Repository
https://github.com/Juless89/steem-dashboard
Website

What is SteemChain?
SteemChain in an open source application to analyse transactions and operations from the STEEM blockchain. Store these into a MySQL database and visualise with charts and tables via the web. Looking to bring data analytics to STEEM like websites as blockchain.com do for Bitcoin.
New Features
A smaller but much needed update. One new feature and implementing feedback from the previous update.
amCharts
Commit: 4e0a55a633210b57b19f1222efe449614d1d8573
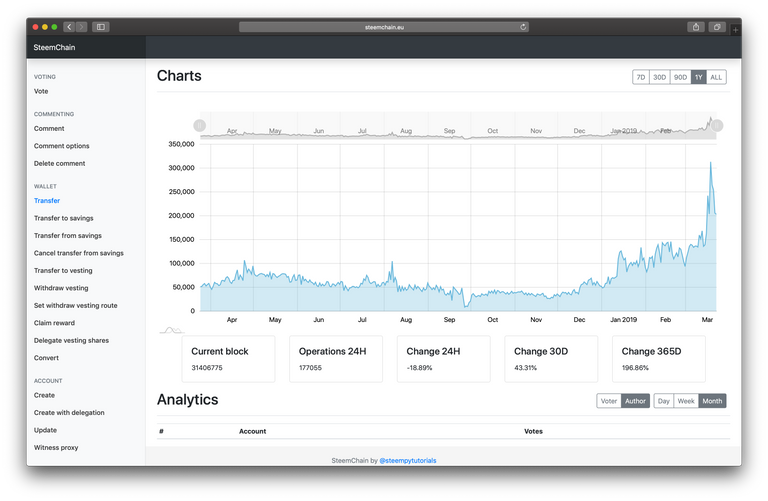
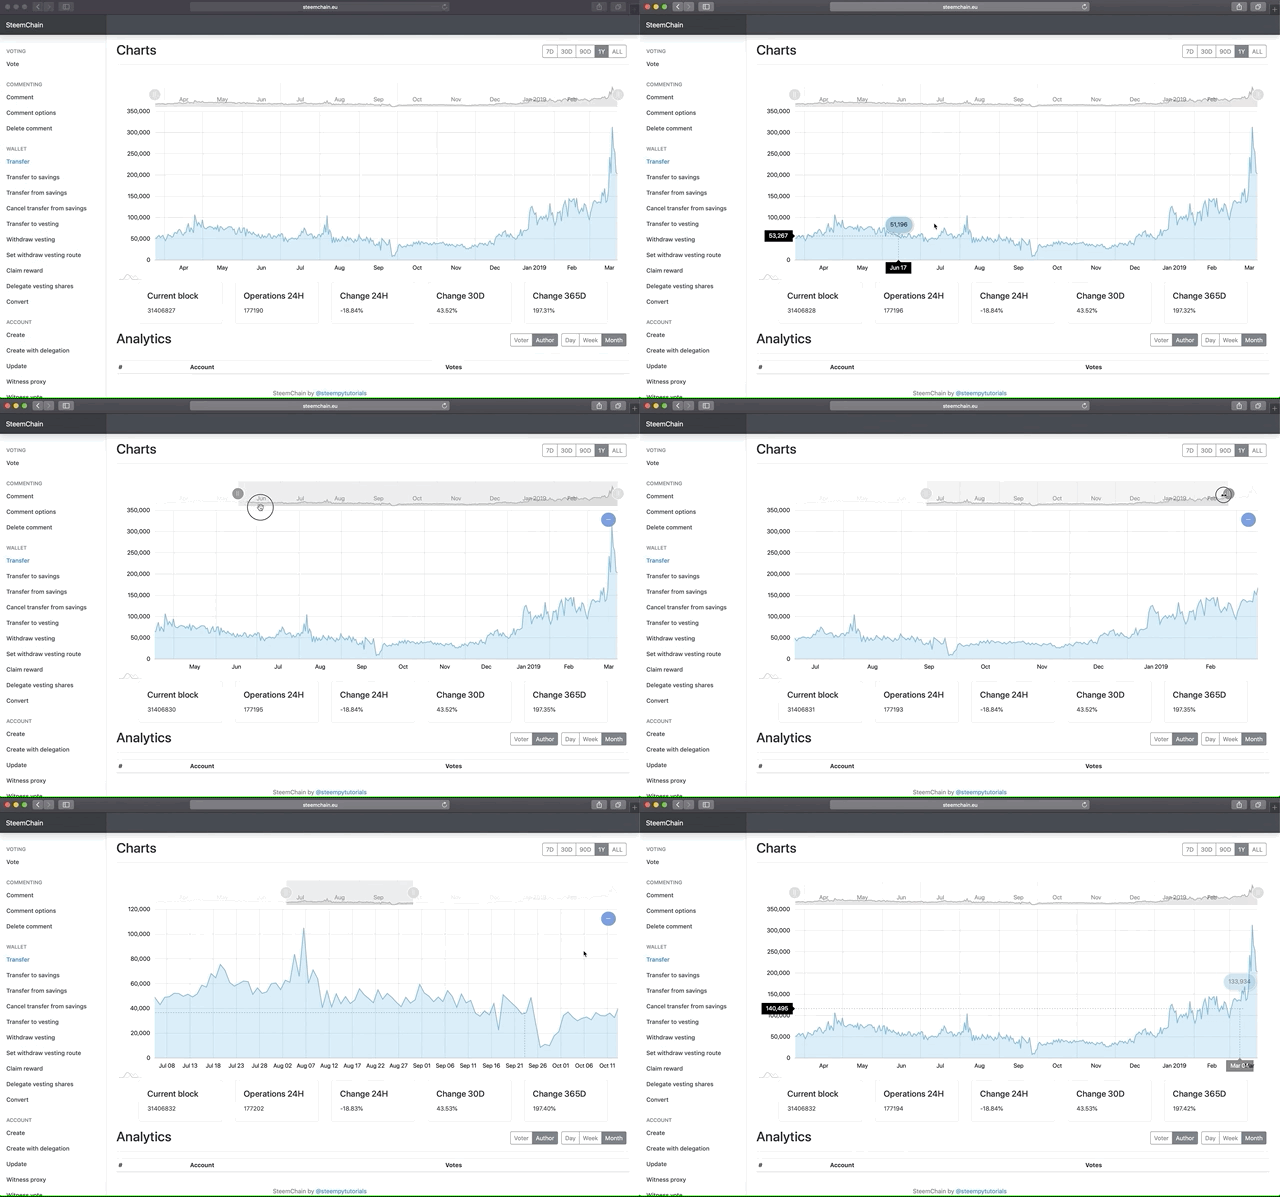
Charts.js has been swapped out for amCharts. Not only does this library deal better with large amounts of data points it also comes with zoom and scrolling functionality. All necessary code changes have been made to accommodate this package.
Small changes had to be made to the API to feed the chart the correct data format. Instead of returning a dict with two lists. The data is now returned as a list where every data point is a dict.
# front-end/api/views.py

# datastruct for response
data = []

# Omit last result, append data into lists
for row in serializer.data[:-1]:
    data.append({
        "date": row['timestamp'],
        "count": row['count'],
    })

return Response(data)

Implemented feedback
Commit: 5043b3f147025d702dad88238c84b9d9c35e3622
As advised most 'import *' have been removed, except for the data models, which include over 100 models. Also long if/else statements have been replaced with switchers.
# front-end/api/views.py

def get_start_day(period, end):
    switcher = {
        "ALL": None,
        "30D": end - timedelta(days=30),
        "90D": end - timedelta(days=90),
        "1Y": end - timedelta(days=365),
        "7D": end - timedelta(days=7),
        "24H": end - timedelta(days=1),
        "12H": end - timedelta(hours=12),
        "1H": end - timedelta(hours=1),
    }
    return switcher.get(period, "Invalid period")
Known issues
- At the moment if no operation occurred in a specific period, the period does not get added. By default this should be set to 0.
Roadmap
- Implement unit testing
- Add analytics for all operation types
- Add user analytics
- Create a daily automated report of important data posted to a STEEM account
- Create an overview with most relevant data as the home page
- Write documentation
The website is really coming along nicely, and I definitely think amCharts is nicer to look at and use than Chart.js, which is pretty surprising to me as I had heard of Chart.js, but never amCharts. I see you've also added a sidebar with all the operation types in a previous update, which looks great as well imo.
Anyway, here's some feedback about the website:
min-heightfor these blocks, as it causes the page to jump around a bit when changing operations.constandletinstead ofvar(indashboard.js).import *anymore, but it can still be improved slightly. According to PEP8 the preferred way of wrapping long lines (in general) is by using Python's implied line continuation inside parentheses, brackets and braces. Long lines can be broken over multiple lines by wrapping expressions in parentheses. These should be used in preference to using a backslash for line continuation.Other than that there isn't really much to say. Will be interesting to see some of the points of your roadmap completed in the future (especially a user analytics page would be cool). Also, if (when) you decide to add unit tests: pytest > unittest!
Thanks for feedback, great as always.
I did not take into account mobile users, and while it's not a priority, target user group should prefer desktop. Adding a menu icon to the header should not be too much work.
Thank you for your review, @amosbastian! Keep up the good work!
Hey, @steempytutorials!
Thanks for contributing on Utopian.
We’re already looking forward to your next contribution!
Get higher incentives and support Utopian.io!
Simply set @utopian.pay as a 5% (or higher) payout beneficiary on your contribution post (via SteemPlus or Steeditor).
Want to chat? Join us on Discord https://discord.gg/h52nFrV.
Vote for Utopian Witness!