Hello Dear Steemian, I want to give a tutorial pemograman sampling and aliasing that I created using matlab. certainly no stranger to a programmer hears the word Matlab. i will explain a little history about Matlab. MATLAB (Matrix Laboratory) is a numerical computing environment that is the fourth generation computer programming language. Matlab was created by Cleve moler in 1970. Moler with Steve bangert rewrote matlab in C programming and founded The MathWorks in 1984 to continue its development. and then in 2000, MATLAb was rewritten with the use of a new set of libraries for matrix manipulation. This is a tutorial sampling and Aliasing using Matlab.
Observation Effect Selection of Visual Frequency Sampling
Program :
clear; % clears the contents of the variable
clc; % cleans the screen
Fs = 8;% sampling frequency
t = (0: Fs-1) / Fs;% normalization process
s1 = sin (2 * pi * t * 2);
subplot (211)
stem (t, s1)
axis ([0 1 -1.2 1.2])
Fs = 16;% sampling frequency
t = (0: Fs-1) / Fs;% normalization process
s2 = sin (2 * pi * t * 2);
subplot (212)
stem (t, s2)
axis ([0 1 -1.2 1.2])
Output

Make changes to the value of Fs, on signal s1 so that it is worth 10, 20 and 30.
Changing the Fs value by 10
clear; % clears the contents of the variable
clc; % cleans the screen
Fs = 10;% sampling frequency
t = (0: Fs-1) / Fs;% normalization process
s1 = sin (2 * pi * t * 2);
subplot (211)
stem (t, s1)
axis ([0 1 -1.2 1.2])
Fs = 16;% sampling frequency
t = (0: Fs-1) / Fs;% normalization process
s2 = sin (2 * pi * t * 2);
subplot (212)
stem (t, s2)
axis ([0 1 -1.2 1.2])
Output

Changing the Fs value by 20
clear; % clears the contents of the variable
clc; % cleans the screen
Fs = 20;% sampling frequency
t = (0: Fs-1) / Fs;% normalization process
s1 = sin (2 * pi * t * 2);
subplot (211)
stem (t, s1)
axis ([0 1 -1.2 1.2])
Fs = 16;% sampling frequency
t = (0: Fs-1) / Fs;% normalization process
s2 = sin (2 * pi * t * 2);
subplot (212)
stem (t, s2)
axis ([0 1 -1.2 1.2])
Output

Changing the Fs value by 30
clear; % clears the contents of the variable
clc; % cleans the screen
Fs = 30;% sampling frequency
t = (0: Fs-1) / Fs;% normalization process
s1 = sin (2 * pi * t * 2);
subplot (211)
stem (t, s1)
axis ([0 1 -1.2 1.2])
Fs = 16;% sampling frequency
t = (0: Fs-1) / Fs;% normalization process
s2 = sin (2 * pi * t * 2);
subplot (212)
stem (t, s2)
axis ([0 1 -1.2 1.2])
Output

Posted on Utopian.io - Rewarding Open Source Contributors
Your contribution cannot be approved yet. See the Utopian Rules. Please edit your contribution to reapply for approval.
Please review your contribution according to the utopian rules.
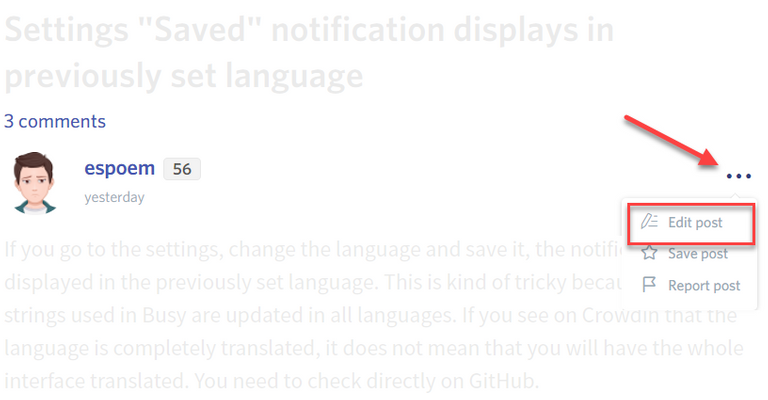
You may edit your post here, as shown below:

You can contact us on Discord.
[utopian-moderator]