Hello All,
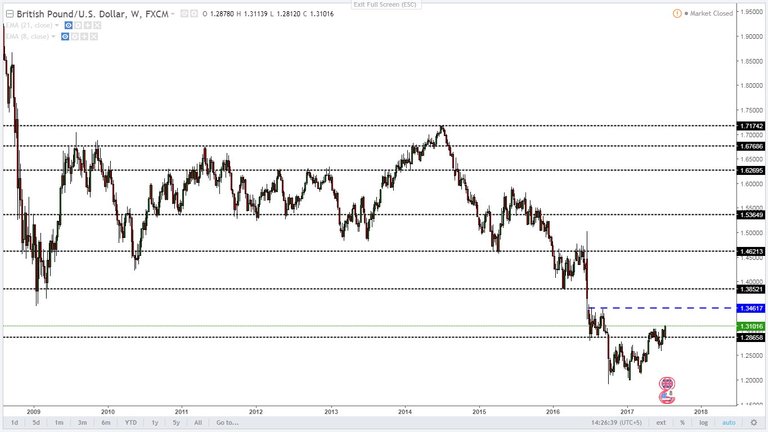
Here is the Weekly & Daily chart of GBPUSD.
WEEKLY SUPPORT & RESISTANCE

DAILY CHART

The GBPUSD is continuously making HH & HL and break the price barrier of 1.2865 and did a restest of this level. So overall this market is looking very bullish righ now and I am going to add buy Positions on any weakness spotted or wait for any price action signal to go long.
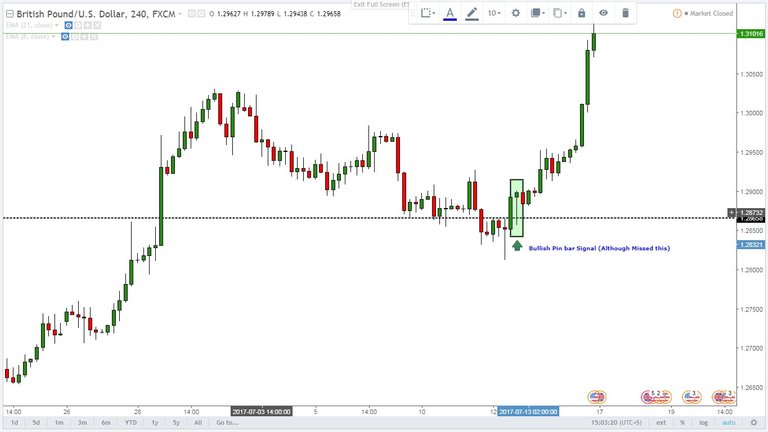
GREAT OPPORTUNITY MISSED ON H4 CHART
However on analyzing 4Hr chart, it was found that 1.2865 area had printed an excellent Bullish Pin bar to go long, though it was missed!!!!

Now lets see how market unfolds from here on!!!! I will keep everyone update on my trading view channel therefore do not forget to follow me at https://www.tradingview.com/u/vikki2810/
nice job follow me and uo vote
I was trading CAD/JPY this last week and it went bullish. Do you think it could go the other direction next week?