Attention: All these tips should be applied in conjunction with the price action. Recall that the indicators are nothing more than tools, which, depending on their formula can serve us to better capture market information. Besides, the default parameter of 14 periods for the RSI indicator is recommended for any time frame.
In advance, I apologize, but in this post, I will omit advice about finding divergences in the RSI because I will include information about divergences in a specific post about Oscillators.
Alright, let's start talking a bit about RSI:
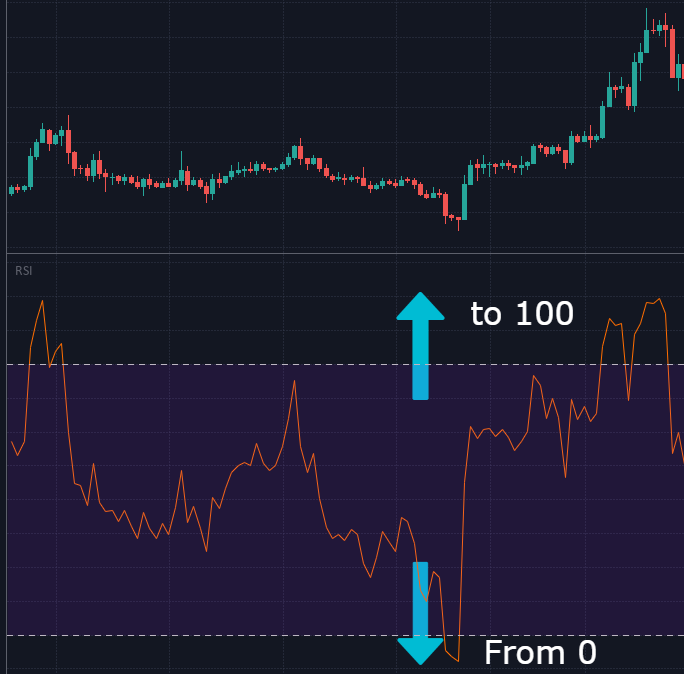
The RSI (Relative Strength Index) is an oscillator type indicator, this entails that its values will range between a minimum value (0) and a maximum value (100). The RSI is used to measure market momentum using the magnitude of recent price changes and thus determine possible overbought levels (above 70 by default) and oversold levels (below 30 by default). This is usually plotted based on the closing price of each time interval and is usually placed in an individual panel below the price chart.
There are different ways to use in the RSI, so I will grant you 3 tips on how to use it, then you can start taking advantage of it if you have not already done so.
1. Overbought and Oversold levels, always in conjunction with additional information.
Yes, it is true, the most usual and the most mentioned in any video, post, etc.... The default way in which people commonly use the RSI is to determine possible levels at which the market has extended too much. However, and something they don't tell you many times, is that normally, this might not go.
You can do the test and you will realize that when the market is in strong trends the RSI touches these levels repeatedly without the market changing its primary direction.
But then, how can we use these levels more effectively?
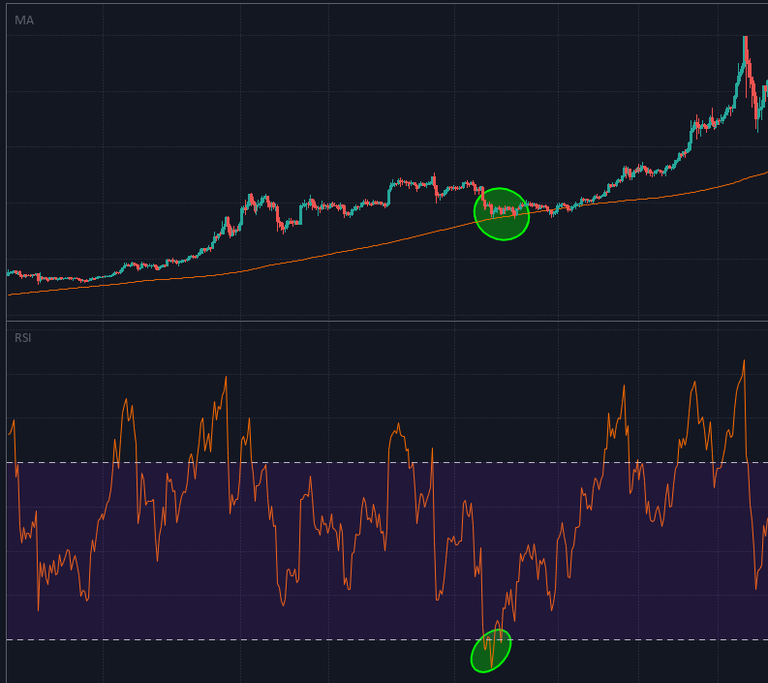
You can combine the overbought and oversold levels with the price action and dynamic resistances or supports (Moving Averages). The logic behind this combination is simple, for example, if the RSI reaches the oversold level at some support or the overbought level at some resistance, the probability that the price will react to this is greater. It is significant to keep in mind that you should always wait for the price to confirm the information offered by the indicators.
Pic 1 - An Overbought level at resistance.
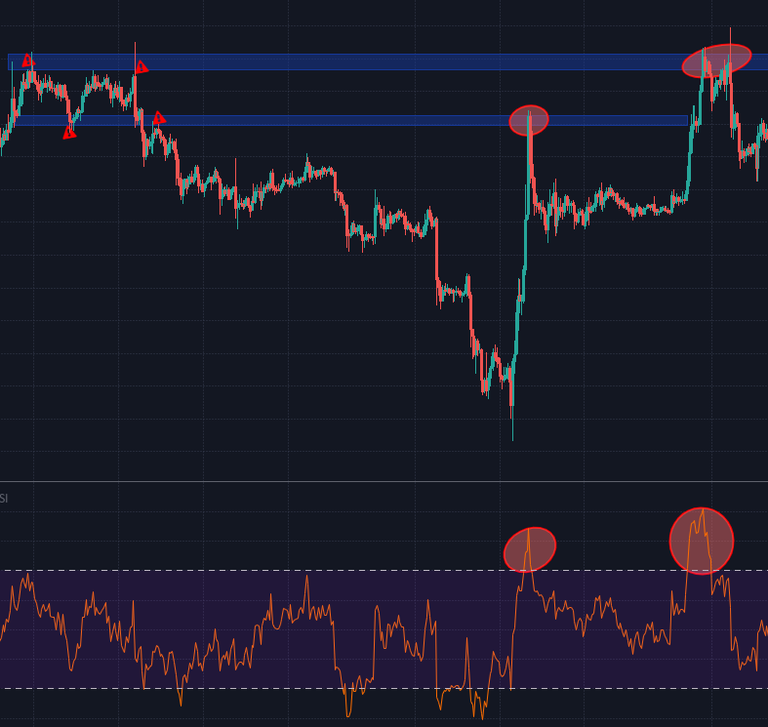
Pic 2 - An Oversold level at support.
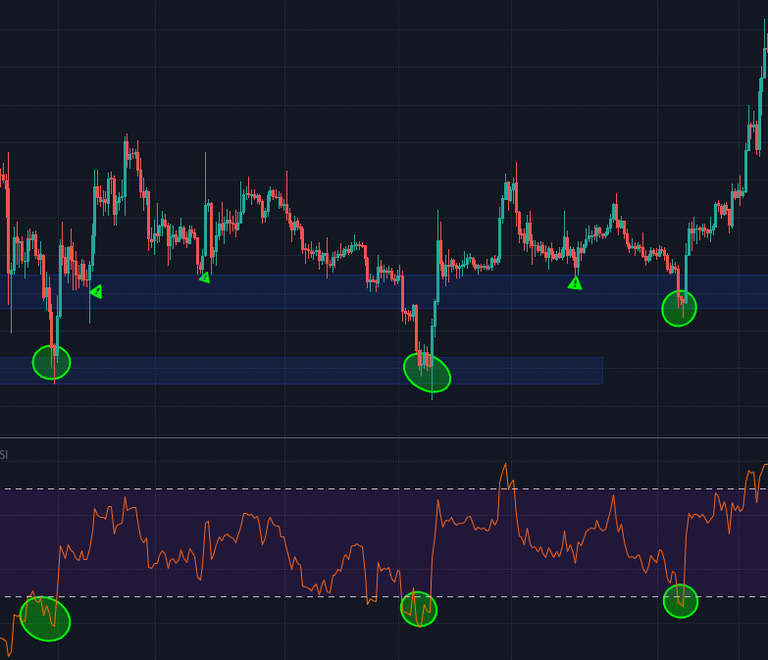
Pic 3 - An Oversold level at dynamic support (200 periods MA).
2. Always check out the middle (50) level line.
Like the level 0 in indicators with a central line, the value 50 in the RSI usually marks an important point to determine the momentum of the market.
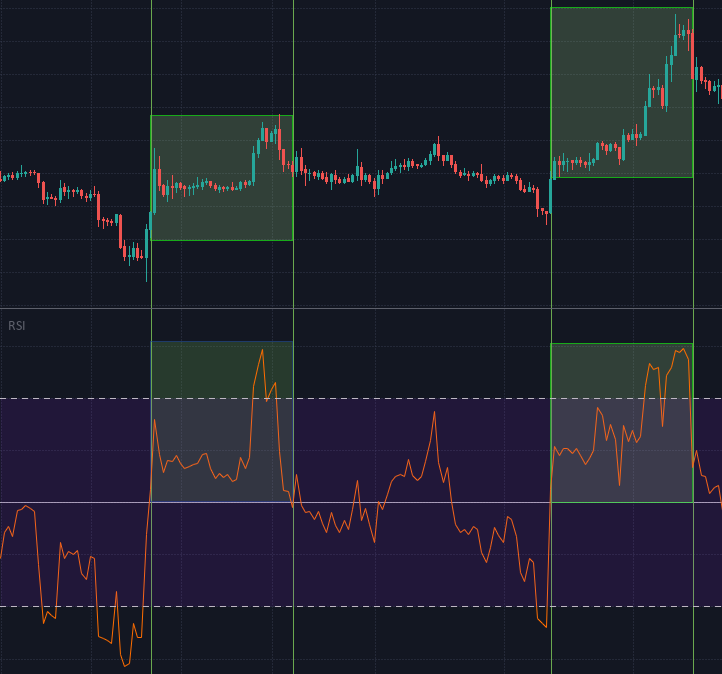
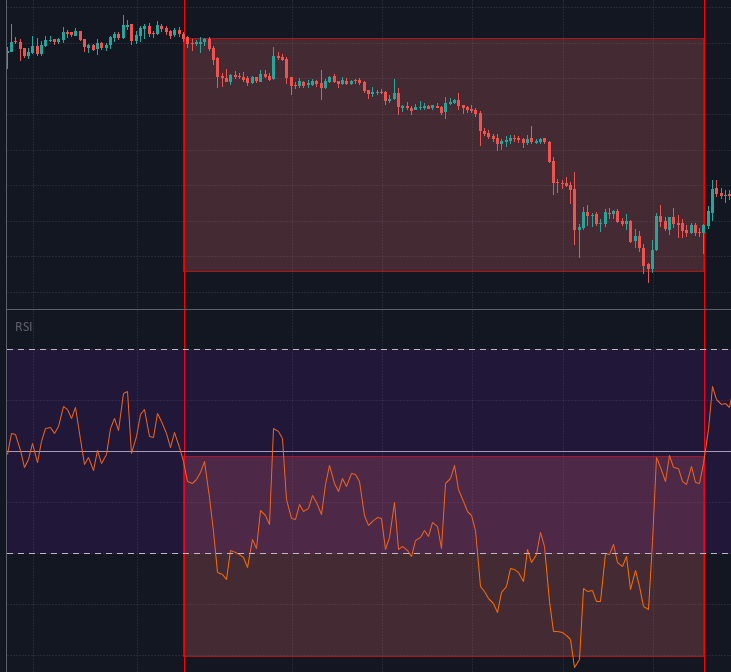
You can use this value as a point of separation between bullish and bearish strength, since in several cases we will see how in a strong downtrend the RSI values remain below 50 even found resistance at this level, and the opposite case in a bullish trend, in this way paying attention to the mid-value line of the RSI can help us identify better probabilities to our trades.
Pic 4 - RSI bullish momentum above the 50 line.
Pic 5 - RSI bearish momentum below the 50 line.
3. Apply Chart Patterns on the RSI
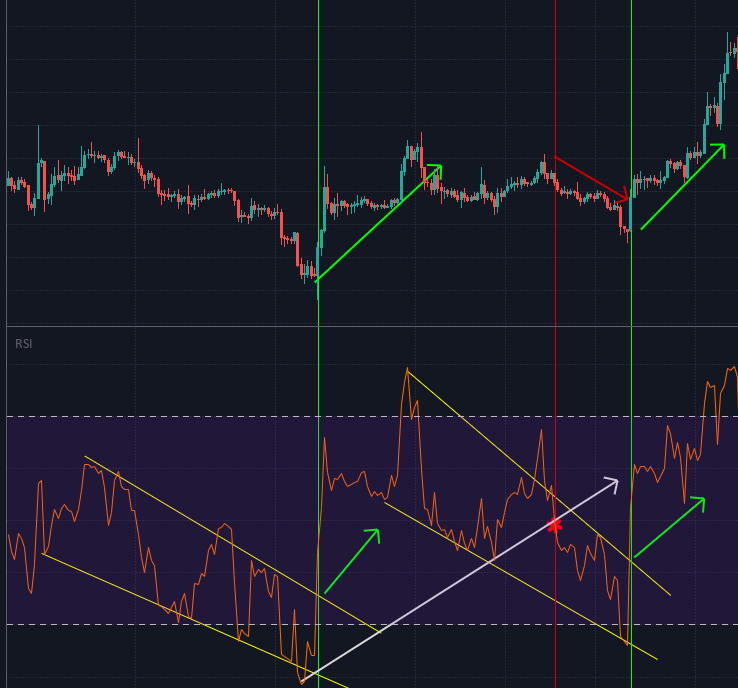
Finally, an option not so common, but equally effective. The RSI is one of the indicators where we can apply chart patterns knowledge as if it were a line price chart, in this manner we can spot trends and patterns on the RSI chart to identify probable price movements.
Pic 6 - Two falling wedges (Bullish pattern) and breakdown of the Trend line on RSI.
Well, that's it for today, I hope you will serve that information if you liked don't forget to support me and if you have any questions, suggestions or opinions or want me to talk about a specific topic, do not hesitate to leave it in the comments
Reminder/Disclaimer:
---All the information found on this blog IS NOT financial advice of any kind, It is just with educational and helping purpose. Investment in financial markets is a risky activity where you can lose a lot of money. Take all your decisions at your own risk--
NOTE: I'm the owner of this content, you can find this article at my social media:
https://trybe.one/user/31072
https://www.uptrennd.com/user/NTIzNjE=
https://steemit.com/@tradingoz
https://www.minds.com/trading0z/
https://www.publish0x.com/the-ever-wanted-trading-tips
You can also find me there with the same username: tradingoz
If a different type of proof is required by admins to prove the ownership I'd be glad to provide it.
In case of verification: Trybe verification
Posted using Partiko Android
Thank you so much for being an awesome Partiko user! We have just given you a free upvote!
The more Partiko Points you have, the more likely you will get a free upvote from us! You can earn 30 Partiko Points for each post made using Partiko, and you can make 10 Points per comment.
One easy way to earn Partiko Point fast is to look at posts under the #introduceyourself tag and welcome new Steem users by commenting under their posts using Partiko!
If you have questions, don't feel hesitant to reach out to us by sending us a Partiko Message, or leaving a comment under our post!
Congratulations @tradingoz! You have completed the following achievement on the Steem blockchain and have been rewarded with new badge(s) :
You can view your badges on your Steem Board and compare to others on the Steem Ranking
If you no longer want to receive notifications, reply to this comment with the word
STOPVote for @Steemitboard as a witness to get one more award and increased upvotes!