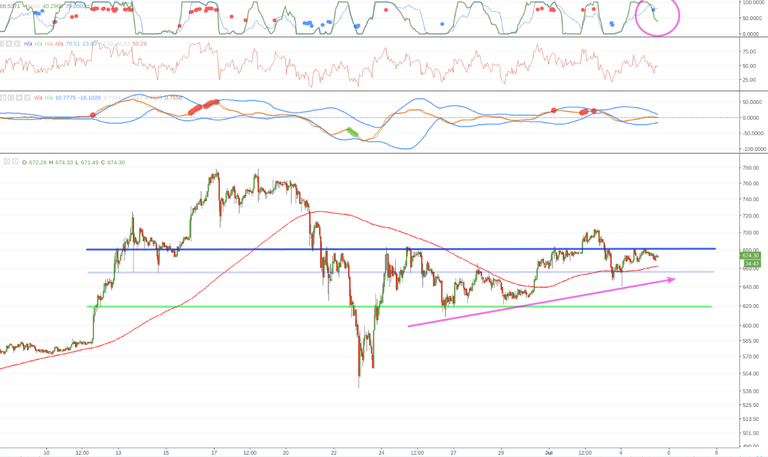
The chart picture still fits the outlook of consolidation to $650 (horizontal pale blue) prior to a block reward halving rally. The magenta arrow in the 1hr chart above suggests that price is using this trendline for support before making a break to the upside.
However, we should remain alert to the possibility that additional decline can still happen. Sometimes market behavior is unexpected – or even irrational. Now that the majority are committed to long positions, some big players may decide to induce selling in order to buy from lower in the chart. Potential Bitstamp targets are $650, $600-$620 (horizontal green) and $560 (the previous low).
The initial signal of continuing decline will be evident from the familiar “breach” rule-of-thumb: if the market opens and closes a 4hr candle below $620 support (green), then the previous low near $560 becomes a likely target.
Upvoted you