Hi steemit community, i want to share my analyse on Omisego with you ....
" It's not investment advice. I am a beginner in the field. Thank you for your understanding"
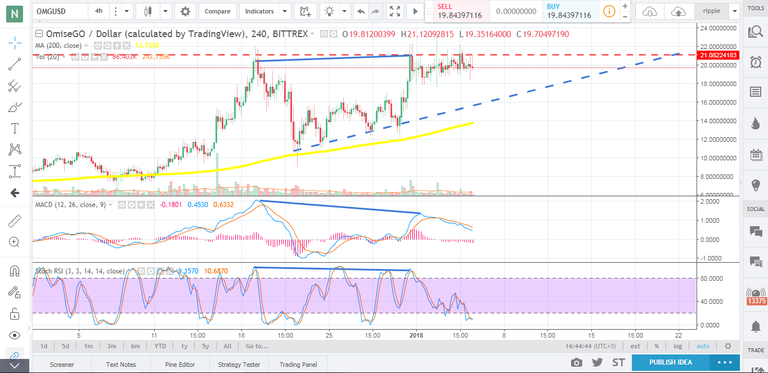
This analysis is OMG/USD on 4h (Bittrex platform)
- The red dotted line is a resistance (around 21.30$), if it is broken, the price of the OMG will go up.
- The blue dotted line is a support, if it is broken, unlike the resistance, the price will go down.
- What is interesting is the divergence between the graph (OMG/USD) and the RSI, MACD (the blue lines). Which is thought of a rise in prices, the break of the resitence in the days to come.
It's just a small opinion that I wanted to share with you, Thank you.
