In the past couple months Bitcoin price went up to around 3000$ and then sudden correction has begun. In couple days the price dropped to a level around 2050$. The one of the reason of such a huge correction was spread of false news on the introduction of the anti money laundering and terrorism financing law. This law does not contain the terms "cryptocurrency" nor the name "Bitcoin" or any other cryptocurrency. This draft law has no effect on cryptocurrencies such as Bitcoin. Decentralized currencies such as Bitcoin and Ethereum are safe and can not be closed because there is no way to do so.
The draft law suggests new rules of holding up transactions and blocking bank accounts along with the new rules of cooperation of GIIF with foreign financial analytics units and Europol. In practice, this means that "suspicious" transactions can be blocked more often, such as those dealing with crypto trading or arbitrage on stock exchanges as well as those paying "suspicious" sums from foreign exchanges. On the institutions obligated in the draft law, including cryptocurrency companies, will be set a responsibility to analyze suspicious transactions that may indicate a relationship to crime, money laundering or terrorist financing.
That means when someone has Bitcoins but doesn't use them againts the law, doesn't have to worry about anything.
Another reason for the price fall is the post published by Bitman in which they claim that on 1st August 2017 the two chains may be released, what can cause the split of network. There will be not enough power to maintain a new chain. BIP148 has no economic sense and is based on speculation. The lack of protection in BIP 148 will result in transactions being sent and acknowledged in both chains. Stock exchanges will be forced to withhold payments and determine which chain they will use.
Our point of view, BIP141 (SegWit) already activated successfully on other blockchains including Litecoin whose price rose significantly as a result of its activation.
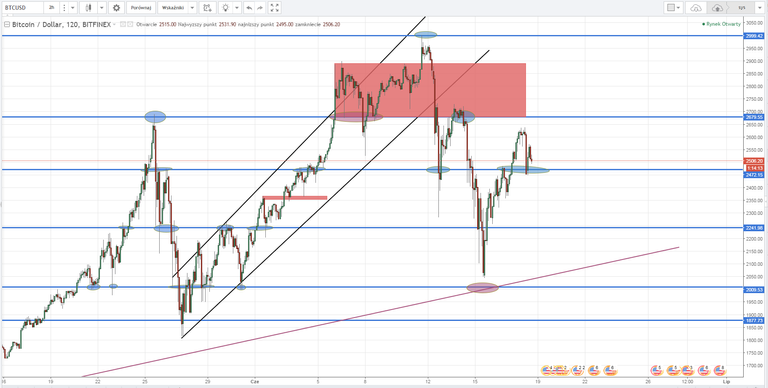
Below we are showing the current situation on the Bitfinex market. The red rectangle has marked the range of consolidation from which the price went up but fell down after reaching the 3000$ level. After that it tested it from the bottom giving a chance of taking short position for short period players.

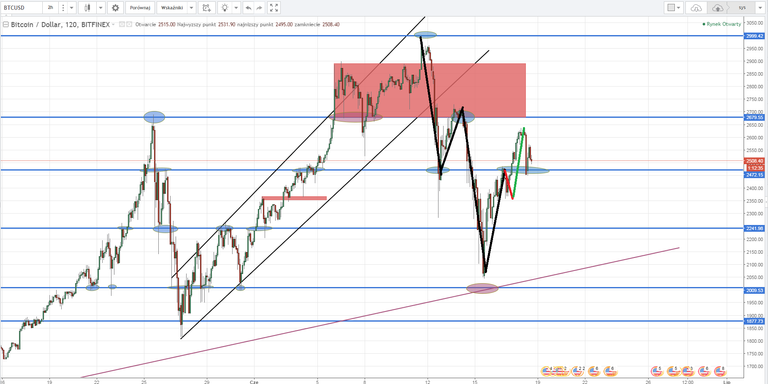
Looking at the graph, you may notice that the downward trend has been broken. The red line marks a reaction to the resistance coming from the other lowering lower and higher peaks. So can the last episode of the black, red and green line be treated as a new impulse? Aggressive players had a chance to buy on the last support test. However, if you are not convinced about the direction of growth, we recommend that you wait until the price breaks Fibo 61.8% and beats another resistance.


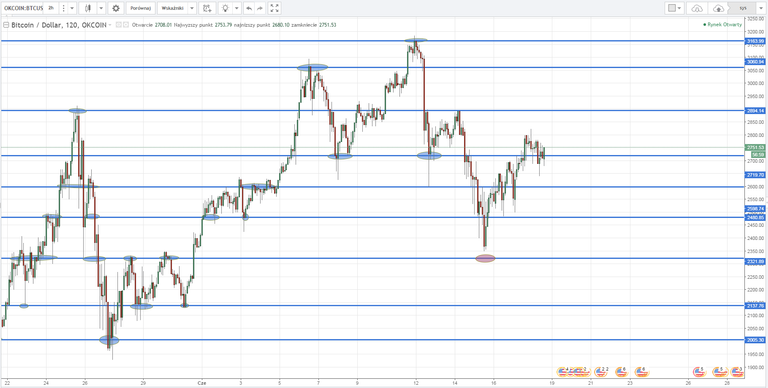
Below a graph showing OKCoin market where the situation looks very similar.

Nice work :)
I have followed and upvoted you do the same for me to help each other thanks :)
@syedwajeehshah
Thanks for this. Upvoted and followed.
My latest work: https://steemit.com/bitcoin/@hgmsilvergold/us-dollar-weakness-is-driving-higher-bitcoin-and-ethereum-prices
Thanks :)