Last week we presented the situation on the technical charts after a hard fork. When it comes to Bitcoin key direction location was support at 2679.5 US dollars. As history shows, it turned out that it was strong enough that the course soared upward. The target to take profit was the flag reach range- 3100 USD. It was heavily exceeded and the price stopped for a while at $ 3,200.
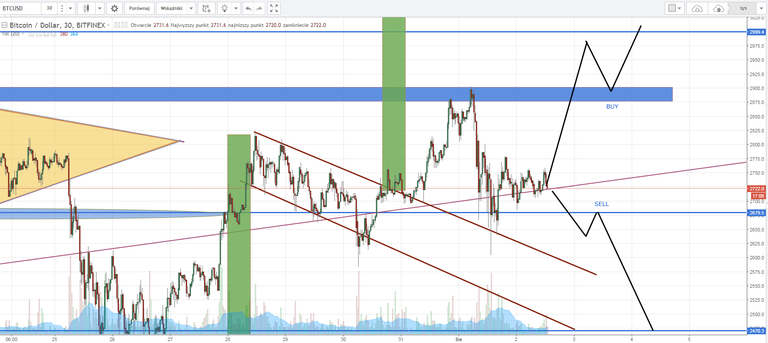
Below last week situation, let's check how the chart looks at this moment.
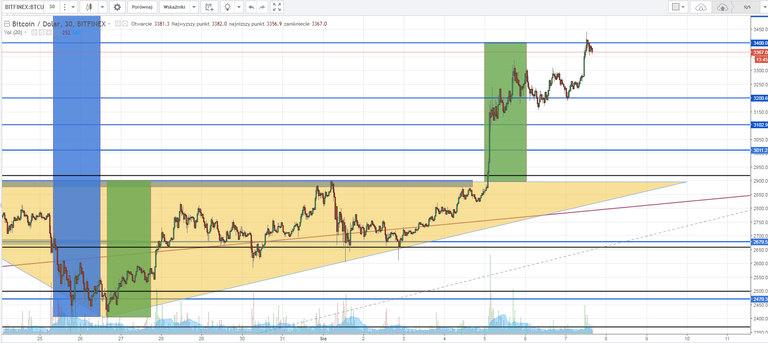
We have highlighted created rise triangle and a growth target range of 3400 USD (green rectangles). What's next? Let's look at the graph from a broader time perspective.
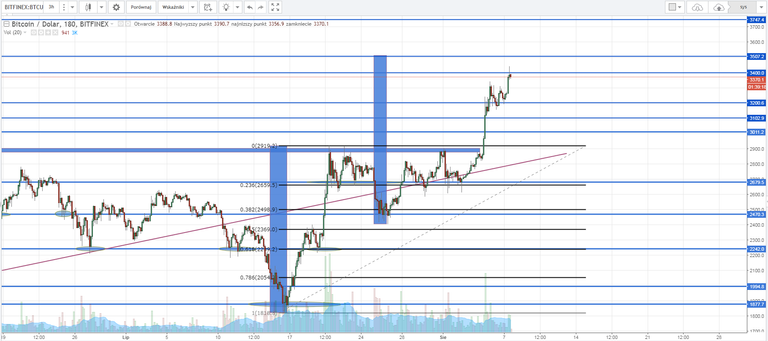
After an upward impulse reaching $ 2,900, the BTC went into a correction phase around the 38% fibo elimination level and 2470 support. The target range for the next pulse of 1 to 1 is therefore around $ 3,500.
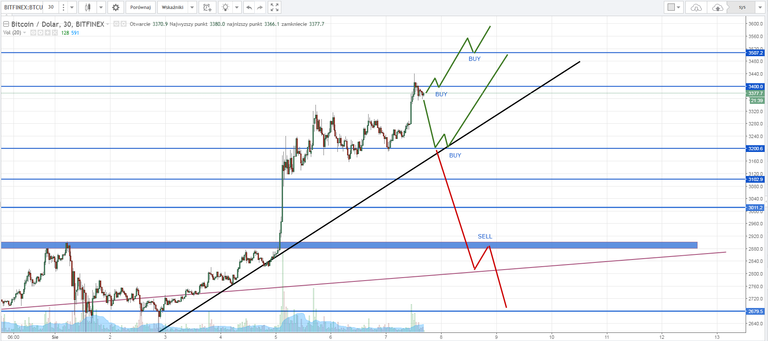
Below market scenarios for the coming days:
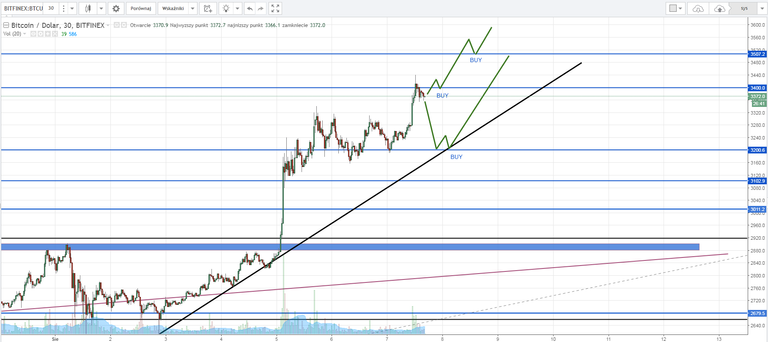
In case of a deeper correction, a good places for the buy signals will be levels 3100, 3000 and 2900 USD, as well. Sales only after the break and test from below the level of 2900 USD.
Congratulations @jpktraders! You have completed some achievement on Steemit and have been rewarded with new badge(s) :
Click on any badge to view your own Board of Honor on SteemitBoard.
For more information about SteemitBoard, click here
If you no longer want to receive notifications, reply to this comment with the word
STOPNice analysis!👌
Resteemed, upvoted and followed.
Thanks