Hi.
I realize most people got an actual life and don't got the time to keep watching their screen waiting for a trade to happen on the minute charts. Luckily Technical Analysis and some basic market research will allow us to maybe buy into a coin in the morning and sell off in the after noon, or maybe you are into doing it every other day. What ever you investment approach is I recommend doing a little bit of trading at least a week to move onto a better position on a coin or get a profit and get in after a correction.
All the numbers used on the strategy are Fibonacci scale numbers because I am channeling my inner da Vinci
3 Factor Trading strategy; EMAs, MACD, MFI and Bollinger Bands for trend measure.
The whole strategy is based on getting at least 2 (if you are on the wild side) preferably 3 or 4 signals on your technical indicators before setting a buy order.
EMA on Fib Scale.
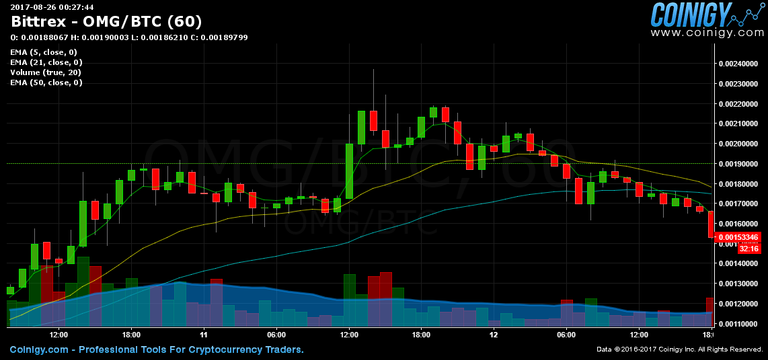
OK so that is basically cheating because the "Fast" Ema (green) its already above the other but the trading strategy behind EMA Crossover its fairly simple, if the "Slow" (light blue) EMAs are above the "Fast" EMA it most of the time signals a down trend, likewise when the "Fast" EMA it's above it means it's on an uptrend.
For this strategy I will be using the Bollinger Bands.
Bollinger Bands
I like these to measure the potential trends and paths the price can take. The 2 extremes are at 2 Standard Deviations from the EMA its set at.
The arrow its signaling to something called the "squeeze" period when the bands are squeezing the price and its on a consolidation period. When the bands widen those are the extremes the value of the coin can reach, Also when the Price graph its above the EMA on the bands its usually a bull run, and when its the other way around its a bear market signal. Again this is a skim overview I encourage you to read further into it.
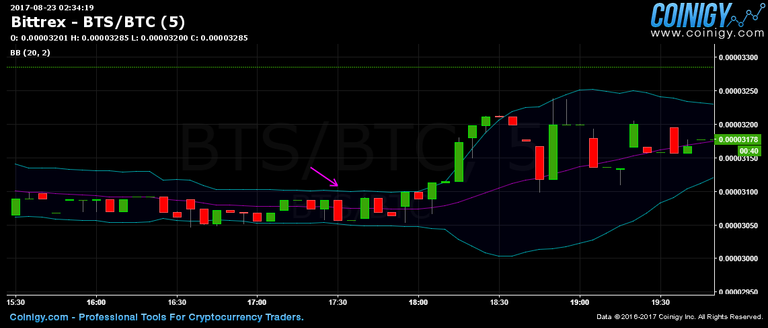
(IMAGE ITS NOT OMG ITS AN EXAMPLE)
MFI
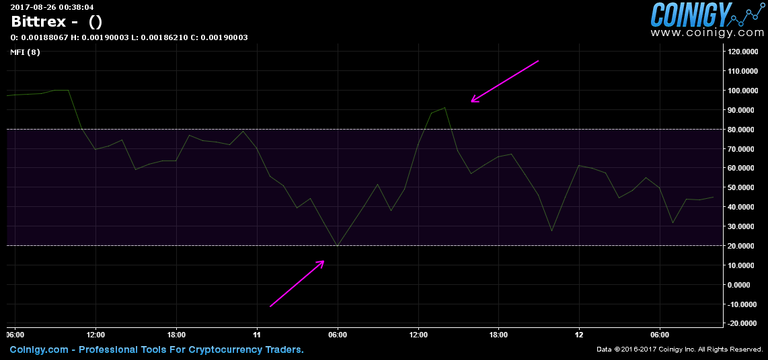
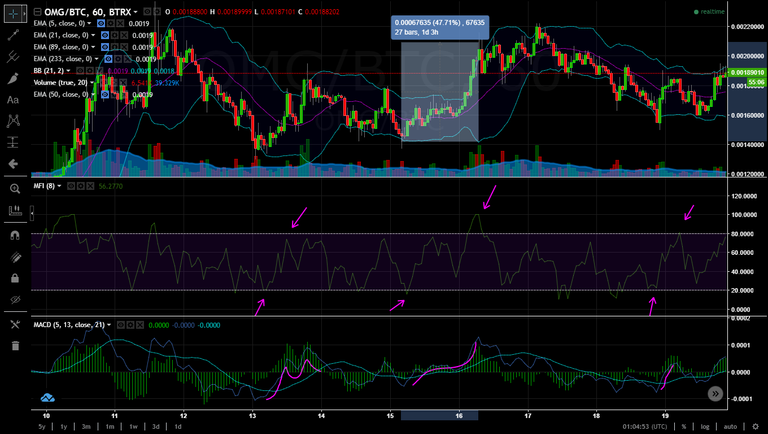
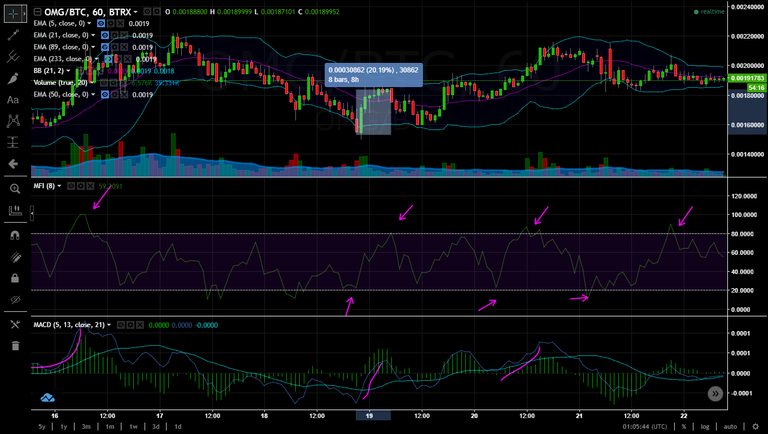
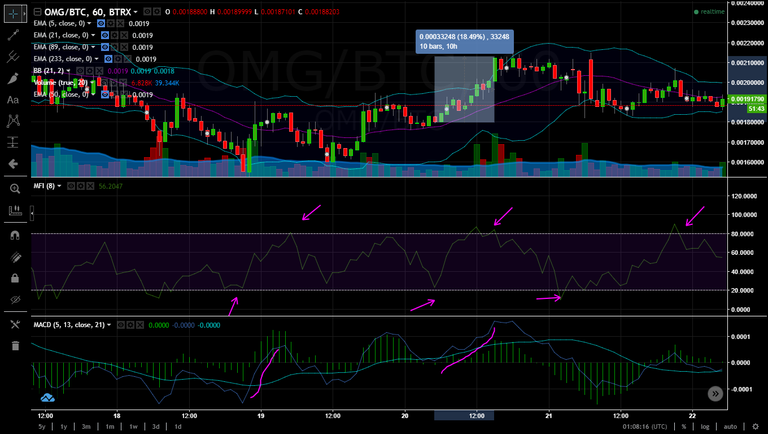
Both the MFI and the RSI are oscillators that help us realize when a coin price its oversold/overbought. The MFI uses both the price and volume into the equation. The trading technique behind both oscillators its very simple when the value in the oscillator falls below threshold it means the asset its getting oversold, at that point a reversal its very likely . Note that it can be a false positive and the value can drop even further you don't want to buy on every signal.
Combined with the MACD
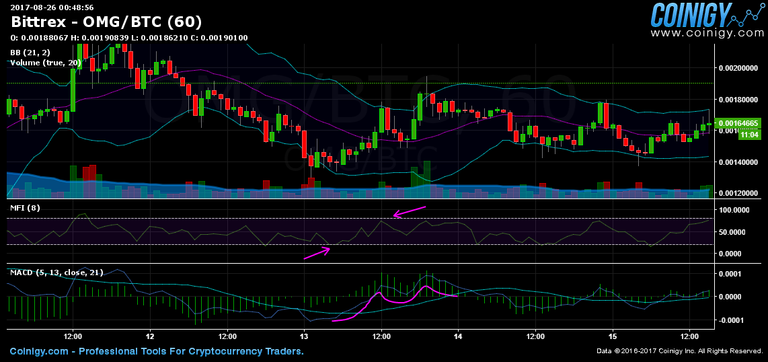
At this point I like to confirm the trend with the MACD, if the signaler its not diverging "a lot" from the actual price chart and the EMA seem to be moving into uptrend I buy in with those 3 signals ready to go.
Sell off
I like to sell off when the Price Action graph its above the EMA from the Bollinger Bands and on a "high" point on both the MACD and the MFI.
Around 85% profit in around 8 days.
Happy Trading and Take Care. Isaac.
Awsome info, thanks for the share. Is there a good way to figure out how to set up all these signals?
You can copy my settings I'm sorry I will edit with the settings i forgot.
Congratulations @isaac331! You have completed some achievement on Steemit and have been rewarded with new badge(s) :
Click on any badge to view your own Board of Honor on SteemitBoard.
For more information about SteemitBoard, click here
If you no longer want to receive notifications, reply to this comment with the word
STOP