GOOD EVENING STEEMIT!
Ah forex. How I've missed you so.
With all of this crypto focus on the blog lately, I just wanted to let you know that I haven't forgotten where my bread and butter is.
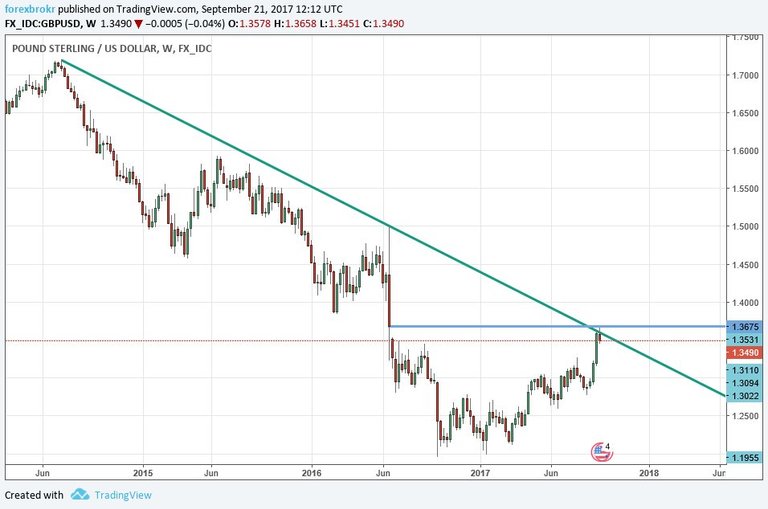
Check out this juicy setup we have on Cable, starting with the higher time frame chart:
GBP/USD Weekly

About as obvious of a trend line that you're going to get on a weekly chart here. This here is your higher time frame level that we'll look to hold if we're going to look to trade from the short side.
I've also included the proper gap fill level from the Brexit drop. Interesting little confluence if I don't say so myself.
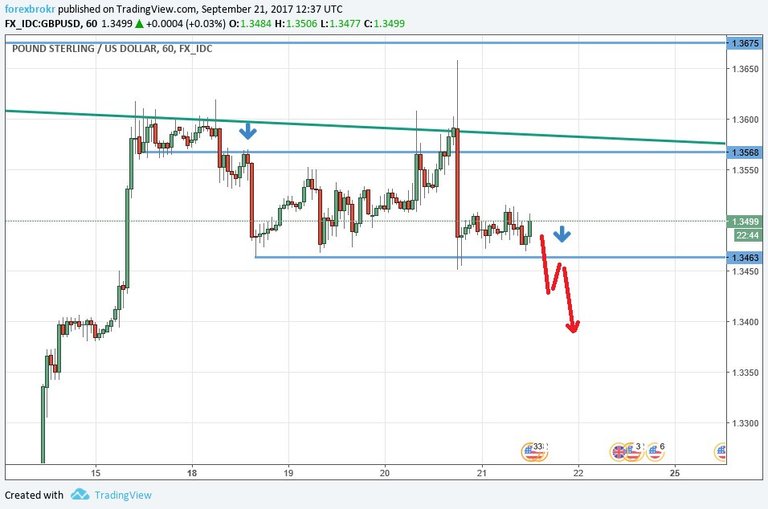
GBP/USD Hourly

Zooming into the hourly chart and this as you can see, I've marked the chart with 2 arrows.
The first represents a hindsight trade whereby short term support turned to resistance and either a nice smash and grab, a breakeven, or a conservative initial entry with your stop above the higher time frame level could have been entered.
The second on the other hand, represents the level that I would hope turns from support to resistance if it does break lower. Just follow the arrows and you can't go wrong!
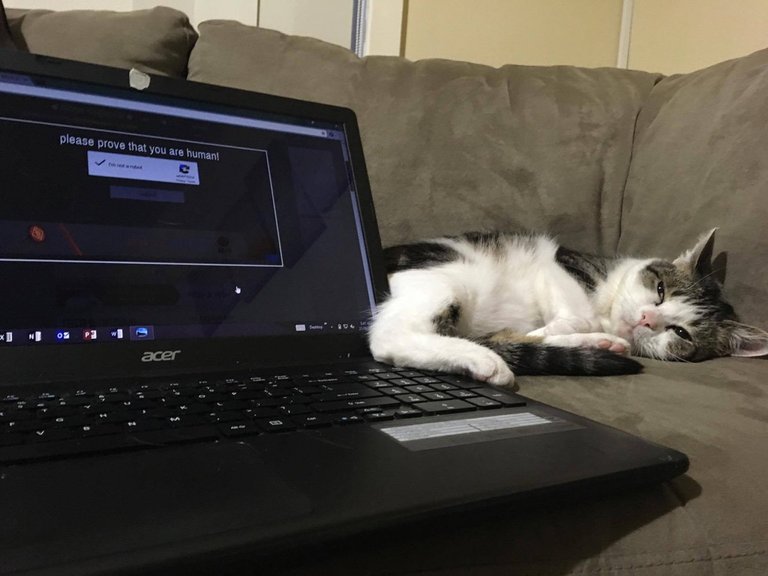
Anyway, before I hit the hay tonight, I wanted to share @ashtar's cat, Chibi:

We call her Dogecoin.
Here she is claiming Doge from a faucet.
She's cute.
We're strange.
Peace!
Related @forexbrokr CHART ART Blogs
Instagram: @forexbrokr
Website: www.forexbrokr.com

great analysis
Just waiting to see if price steps down again intraday.
I follow you @forexbrokr for more good information ,keep it up.
Hope you like markets! :)
Looks like a nice rounded bottom on the GBP/USD Weekly and there is a bit of a wedge happening off the low in early 2017. Would be brave to be short here without some tight stops. I'd be looking for the trend-line to break and sharp move up would be a reasonable risk/reward play.
Will only short if price makes a new low and retests that short term previous support as resistance. (Arrow 2)