I think the biggest and most interesting mistakes in trading are the same ones that all humans are prone to, regardless of their chosen areas of interest. I find these general errors of judgement to be the most fascinating as we all fall prey to them, even when we should really know better. In fact, there are a host of experiments in behavioural economics going all the way back to the late 1970s, showing that even statisticians (people whose jobs depend on them knowing better) are as vulnerable to certain cognitive biases and logical fallacies as the rest of us.
From a young age children demonstrate themselves to be particularly adept at pattern recognition. These abilities to draw connections, condense information and use narratives to explain complex phenomena are what set us apart from other species, but they can also make complete fools out of us when trying to come to terms with the randomness of markets.
Talk to a trader who's convinced that they've figured out a pattern in the 15 minute chart they're trading, and that by using a combination of five different technical indicators and a convoluted set of rules and exceptions, that they can predict where the price is going to go next. It's fundamentally the same logic as that of the gambler who, against his better judgement, feels in his very bones that just because the roulette wheel has come up black for the last four turns, that somehow the probability of the next roll being red has increased.
Chart gazing can be a particularly intoxicating business because our minds are constantly seeking to impose order on the phenomena we observe. One of the most useful pieces of trading advice that comes to mind is: Do NOT confuse the map with the territory. The chart is just a map, and a particularly low resolution one at that, it can tell you next to nothing about why the terrain is the way it is and how it's likely to change in the long term.
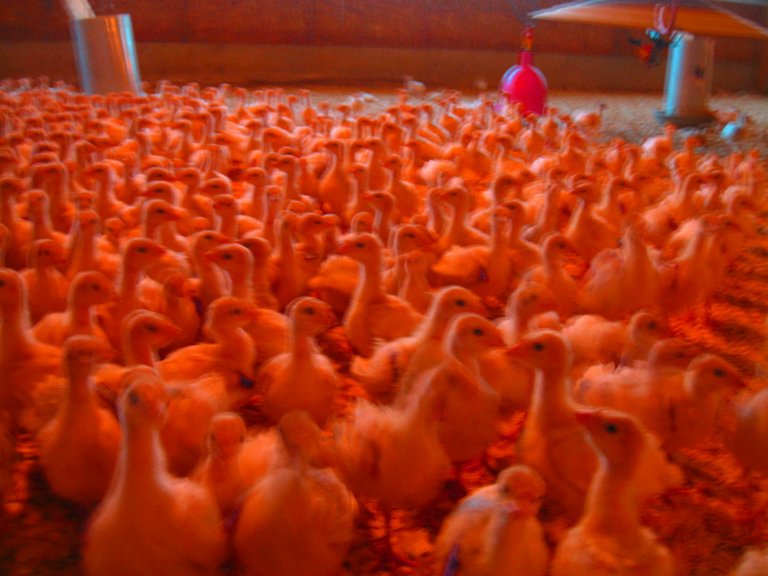
The best way to illustrate this is with an example that Nassim Taleb uses in his book The Black Swan. If you were to see a turkey's growth plotted on a chart for the last one thousand days prior to Thanksgiving, it would look pretty damn bullish, right? No evidence of any imminent Black Swans. But it pays to remember that absence of evidence is not evidence of absence. The chart fails to show us what is really going on in the background. To quote Mr. Taleb: “From the standpoint of the turkey, the nonfeeding of the one thousand and first day is a Black Swan. For the butcher, it is not, since its occurrence is not unexpected. So you can see here that the Black Swan is a sucker's problem.”
The moral of the story? We tend to see patterns everywhere, even when they are meaningless. Try to avoid the impulse to look for tidy rules and perfect shapes as these are always easy to spot in hindsight, but going forward they rarely hold up. In short, try not to be the turkey, especially with Christmas around the corner!

Congratulations @failbetter! You have received a personal award!
Click on the badge to view your own Board of Honor on SteemitBoard.
Congratulations @failbetter! You received a personal award!
You can view your badges on your Steem Board and compare to others on the Steem Ranking
Do not miss the last post from @steemitboard:
Vote for @Steemitboard as a witness to get one more award and increased upvotes!
Congratulations @failbetter! You have completed the following achievement on the Hive blockchain and have been rewarded with new badge(s) :
Your next target is to reach 50 replies.
You can view your badges on your board and compare yourself to others in the Ranking
If you no longer want to receive notifications, reply to this comment with the word
STOPSupport the HiveBuzz project. Vote for our proposal!