It is interesting to watch how markets move. Some move opposite ways when the conditions are optimistic. Most move together when the fear is in the air.
It was a bullish move after the fork. Then it went up too much, too soon, and it needed a correction somehow. 5000 was a round and good number. You always watch out round numbers. Although nowadays S Korea has bigger volume and maybe we will need to watch the Korean won instead of USD.
I will share some of my findings related to correlations here which was interesting to me.
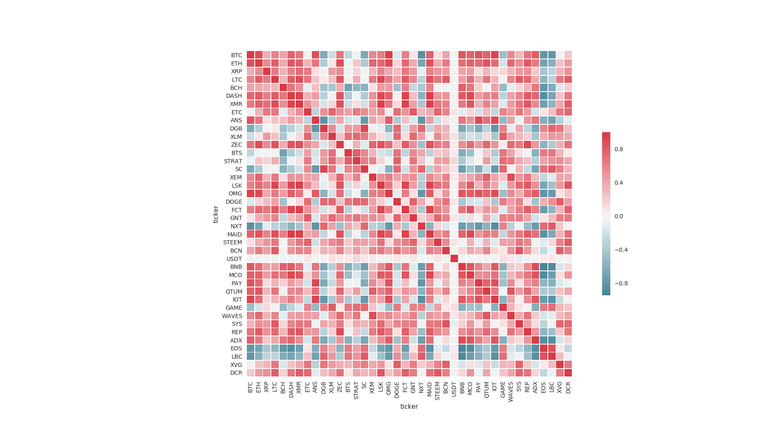
This is correlations of 5 minute price action during August.

High resolution here: https://imgur.com/a/1xlXf
Probably everyone were mostly going up, some more quicker, some more slower. Thats why some are green and some are red.
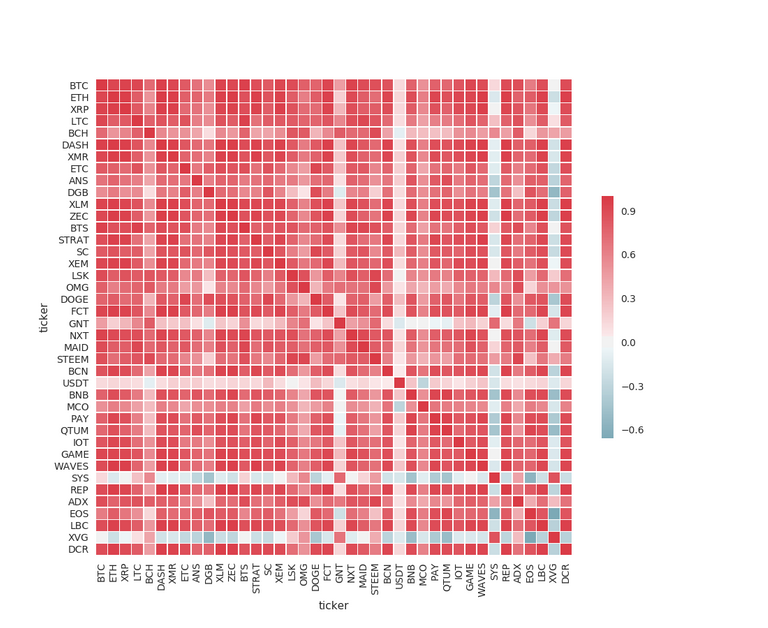
Then notice first 7 days of September, a lot has changed:

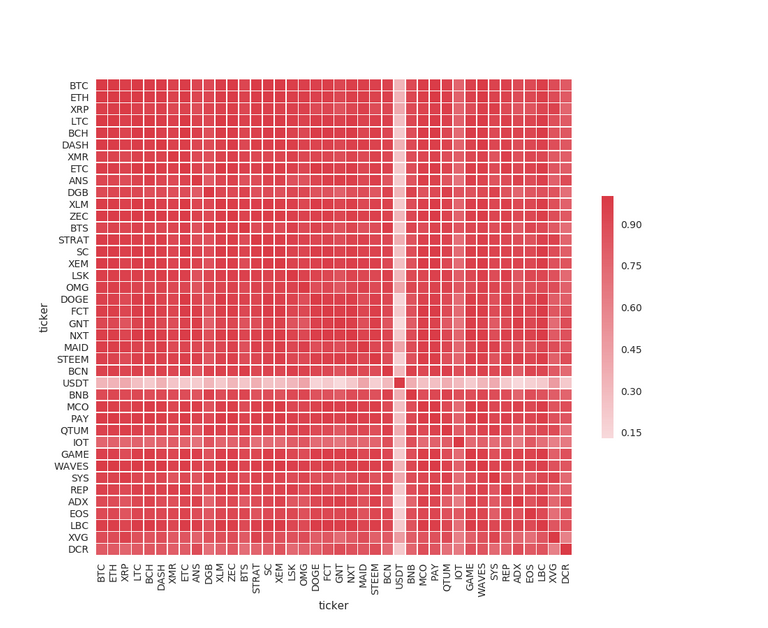
And when we come to second 7 days of September, notice everything turning to high correlation. I.e. it does not matter how promising the project or how good the community or the distribution is. All going in the same direction with same speeds:

Which makes me wonder if there are statistical arbitrage opportunities. I.e. knowing that they had high correlation in the past, but recently they are diverging, one can go long and short with the two coins. Buy the thing that is underperforming and sell the high performing one, hoping that they will get together eventually.
Nice article buddy.....!! upvote done, checkout my blog as well....cheers...!
I think you have a fantastic understanding
Excellent and useful article. Thanks for sharing man
Congratulations @deaddy! You have completed some achievement on Steemit and have been rewarded with new badge(s) :
Click on any badge to view your own Board of Honor on SteemitBoard.
For more information about SteemitBoard, click here
If you no longer want to receive notifications, reply to this comment with the word
STOPDo not miss the last announcement from @steemitboard!