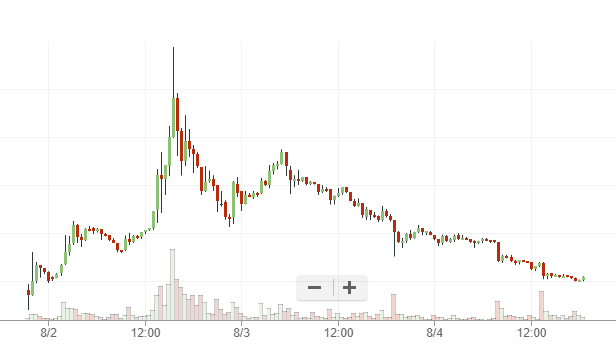
What a wonderful Bitcoin Cash chart! All human emotions are on display.

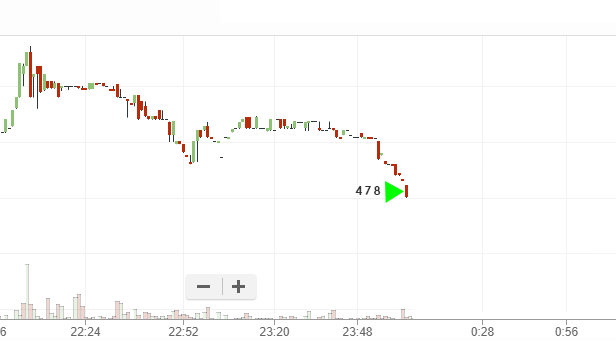
It's interesting how the human brain works. I traded this chart all the way down. And what I've learned is that you need to read your own emotional states. It helps to understand what other people feel and what they will likely do. Let's look at one my trades:

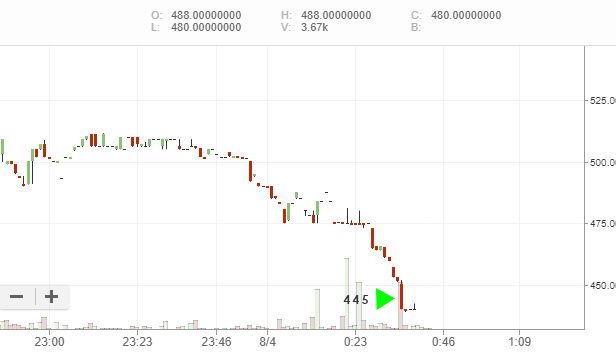
Not the best place to buy, but I saw the huge green wall and I thought the price will likely bounce off from this level. But within the next few minutes, that wall just disappeared! What did I feel at the moment? Fear. But I understood that at the exact same moment all people in the room feel fear. So I bought again at 445:

Since I have already made about 5 successful trades before this point, I knew that the buyers were very strong in this chart. So I did not sell on the fake breakout and kept waiting for the level of broken support:

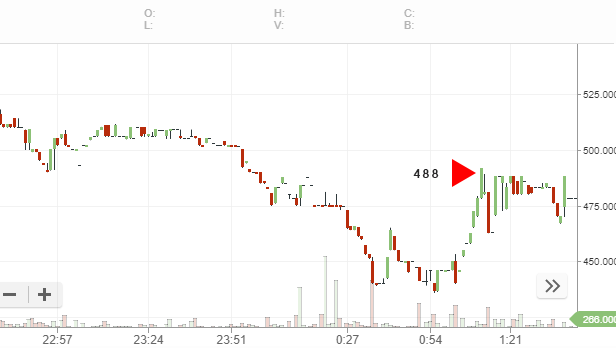
All this time I controlled my emotions. If I did not, I would lose money. And finally I sold the position on the rebound:

That's how I saved the bad trade. I made the mistake in the beginning but rectified the situation by reading and controlling my own emotions.
I started day trading a month ago and I'd like to say it's very entertaining. When the timeframe is so small the TA is useless. There are only primal instincts and that is the reason why you actually can make trades with 99% success ratio.
Now about the future of Bitcoin Cash. You know, the more I learn about the market the more often I accept the side of the minority. Because the minority is that 10% who wins. They don't write "Dump" tweets when everybody does.
Speaking in terms of classical TA now we are on Elliott Wave C. So I'm accumulating. I'll enjoy the price under 200 or 100. For me, this sounds crazy, because it's not an altcoin how the majority thinks, it's a new Bitcoin!
Imagine you've bought a Bitcoin Core at this prices. Now is the same moment.
