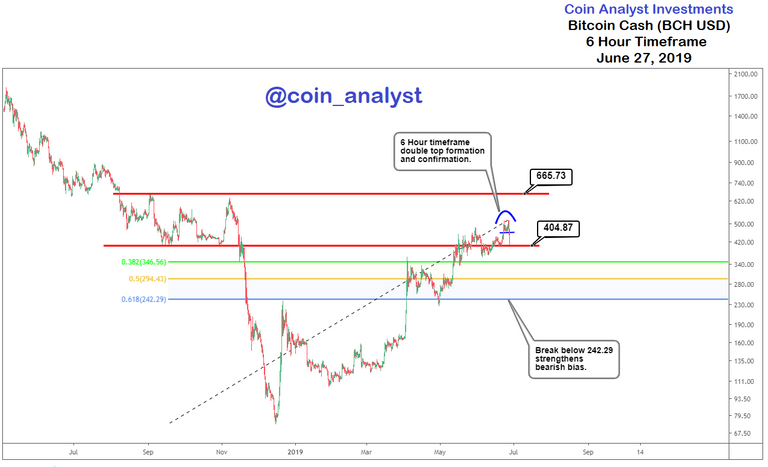
Conclusion for today’s Bitcoin Cash Analysis: Price closing below ~242.29 implies an increase in bearish strength.
The 6 hour timeframe of Bitcoin cash is presented using bar charts and a log scale. Price action from May 06, 2018 to current date is the main focus, with the duration having a downswing in price followed by the current upswing (uptrend).
Instagram: https://www.instagram.com/coin_analyst/
Twitter: https://twitter.com/Cryptotrader029

Current resistance that is active is also marked on the chart between 665.73 and 404.87. A confirmed double top formation (bearish) is also observed within the resistance price levels and indicates more downside action to follow.
Immediate support for the current uptrend (retracement) is anticipated at either 346.56, 294.43 or 242.29 price level where Bitcoin cash could consolidate prior to the resumption of the current uptrend.
Price closing decisively below 242.29 (the 61.8%) retracement of the uptrend implies an increase in bearish strength.