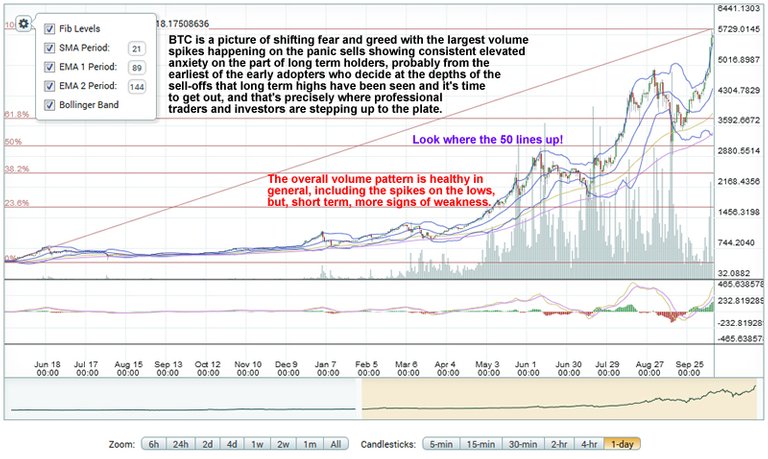
Another Bitcoin chart with more volume history showing some weakness, not necessarily to sell, but rather to use as a guide for where you might see the next opportunity to buy (and hopefully some upside in Alts in the meantime 😏 ).

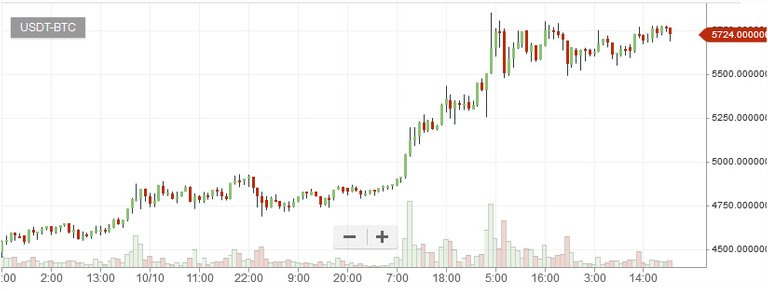
And the 1 hour chart. Is this a high and tight flag?

If so, there are very high probabilities of it breaking higher. http://thepatternsite.com/htf.html
One last run? To the secondary targets? I think we'll have the answer shortly.