The concept of support and resistance is a key cornerstone for technical analysis and it also has strong ties to the behavioral finance concept of 'anchoring'. In technical analysis, for markets that are ranging (as opposed to trending), the concept of support and resistance lends itself to the following axioms
- In a ranging market, wait for a break out, there is no need to anticapte it. In fact, you should probably be fading breakouts
1a) If there is a false breakout, look for prices to retrace back into the range - Once a breakout occurs, previous resistance becomes support and vice versa.
- Once a breakout occurs you can use a combination of the time spent within the range and the range size as references values to project profit levels for breakout trades.
Lets look at the following chart of the stock EEM for some concrete examples
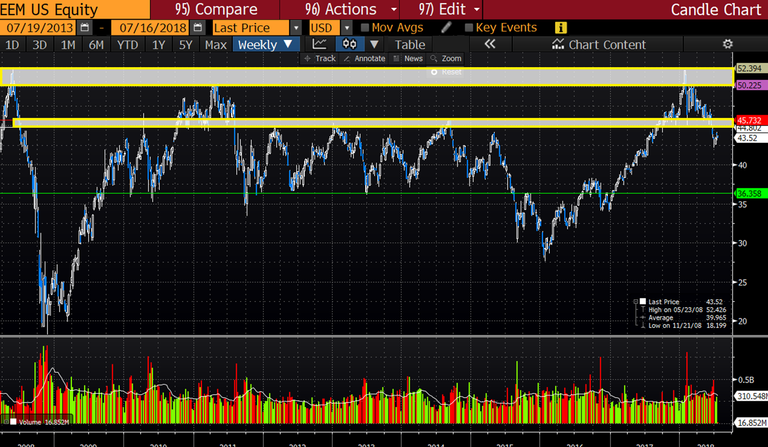
We can see that for several years the price traded within a range of $36 -$44. Then in 2016 prices broke to the downside for a brief period, followed by a strong up move in 2017. In 2018 prices touched the previous period high ~52 and have since retraced back below previous resistance (which should have acted as support ~45).
For the period between 2012 and 2015, a trader would have been well served buying range lows and selling range highs. But starting in mid 2015 this strategy stopped working. Luckily if you had been holding an offside long position, prices retraced in 2nd half of the year and gave you an exit opportunity close to your entry point. From there into early 2016 there was a very sharp selloff of almost $10, about equal to the $10 range size that existed from 2011-2015. While it would have been tough to go all in long, just by looking at the chart, shorts should have been taking profits at that level.
Once prices rebounded back into the old range support, in mid 2016, that should have been a sign that the 2016 breakout was a false one and traders should have been looking for a move to the other range extreme, which occurred in 2017.
In early 2018, prices tested the all time highs but failed. While a good trade set up was presented to buy at the previous resistance levels around $45-46, any traders who did so are currently offside. Hence why traders always need to have a stop loss, and with all technical analysis, its never perfect.
My personal preference of the current set up would be to get very long ~ $36 and if not, wait for prices to go above $46 as confirmation that the recent sell off is done and then go long. Short may be added but should have tight stop losses and look for a move below $40
Congratulations @avimiami! You received a personal award!
Click here to view your Board
Do not miss the last post from @steemitboard:
Vote for @Steemitboard as a witness and get one more award and increased upvotes!
Congratulations @avimiami! You received a personal award!
You can view your badges on your Steem Board and compare to others on the Steem Ranking
Do not miss the last post from @steemitboard:
Vote for @Steemitboard as a witness to get one more award and increased upvotes!