Hi,

In this post, I will describe how to load historical data from poloniex exchange.
The API calls that were introduced in previous post would be used.
We first define start and end time of the historical data.
nowtime = datetime('now');
starttime = datenum(nowtime - calmonths(month)); % starting from 3 month before
endtime = datenum(datetime(posixtime(nowtime),'ConvertFrom','posixtime'));
- nowtime = datetime('now'); command returns current time in MATLAB format (2017-06-28)
- month is an integer value, here I define month = 3;
- datenum() function converts time with a format (2017-06-28) to certain number (736782.991378831).
The time in format of number does not match with standard in Poloniex.
Poloniex API requires UNIX time stamp.
Following codes converts the start and end time into UNIX time stamp.
starttime_UNIX = int32(floor(86400 * (starttime - datenum('01-Jan-1970'))));
endtime_UNIX = int32(floor(86400 * (endtime - datenum('01-Jan-1970'))));
In poloniex, chart data is stored in candle format.
So we need to select which candle to load.
The period is defined in unit of second.
% period 300 (5-min), 900 (15-min), 1800 (30-min)
%       7200 (2-hr), 14400 (4-hr), and 86400 (1-day)
Let's choose 4-hr candle as period = 14400;
By executing following code, you could receive response from poloniex server.
command = 'returnChartData';
params = ['¤cyPair=' pair '&start=' num2str(starttime_UNIX) '&end=' num2str(endtime_UNIX) '&period=' num2str(period)];
response = POLO_Call(command,params);
Let's define the above codes as a function POLO_ChartData().
Following code will retrieve historical data of BTC/XMR.
pair = 'BTC_XMR';
response = POLO_ChartData(pair, starttime, endtime, period);
The response is JSON format, and we parse the data.
>> json2data = loadjson(response);
>> json2data

json2data =

    candleStick: {1×550 cell}
          range: 7905600
Here, we see that with 4-hr candle, in three month, there are 550 candles.
Let's take a look at 1st candle. It includes high, low, open, close, volume.
>> json2data.candleStick{1}

ans =
 struct:

               date: 1490745600
               high: 0.01931
                low: 0.01860777
               open: 0.0188
              close: 0.019
             volume: 505.5160921
        quoteVolume: 26601.71798278
    weightedAverage: 0.01900313
Let's try to collect close values of all candle.
>> nCandle = length(json2data.candleStick);
closeVal = zeros(nCandle,1);

for i = 1:nCandle
    closeVal(i) = json2data.candleStick{i}.close;
end
>> closeVal

closeVal =

                     0.019
                   0.01938
                   0.01845
                0.01869999
                0.01906999
                0.02019995
                0.02000641
                    0.0199
                0.01979995
                0.01961846
                 0.0192058
                  0.019078
                  0.018788
...
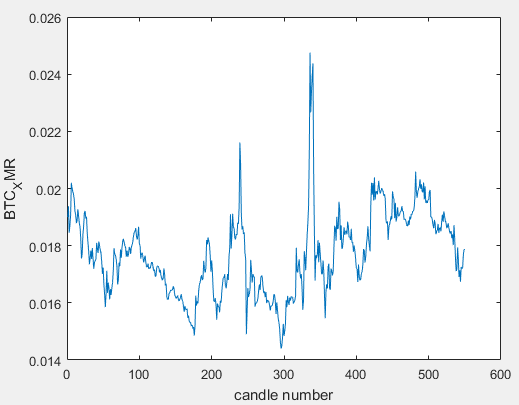
Executing following code returns BTC/XMR chart.
figure; plot(closeVal); xlabel('candle number'); ylabel('BTC_XMR');
That's it for today, I hope you follow my post. Have a nice day.

✈ This is great post! Thank you for giving me awesome tips! I'm gonna try it!
Thank you for your interest. You could start from beginning :)
In the past. I wrote an algorithm trader for forex. it worked brilliantly while testing with $100 real dollars. When we switched to $10,000, it lost every trade. Turned out that the broker was stealing from us on every trade. Moral of the story is be careful who you do business with. Thieves are attracted to the finance game and they go all the way to the top.
Wow that's a big story that I also have to learn from it. Be careful to middle man, there may be thieves.
Thank you for sharing your experience I would definitely be careful too.
Great information. It feels difficult for me.
Thank you for sharing this, I'm following you ^^
Congratulations @algorithmtrader! You have completed some achievement on Steemit and have been rewarded with new badge(s) :
Click on any badge to view your own Board of Honnor on SteemitBoard.
For more information about SteemitBoard, click here
If you no longer want to receive notifications, reply to this comment with the word
STOPBy upvoting this notification, you can help all Steemit users. Learn how here!