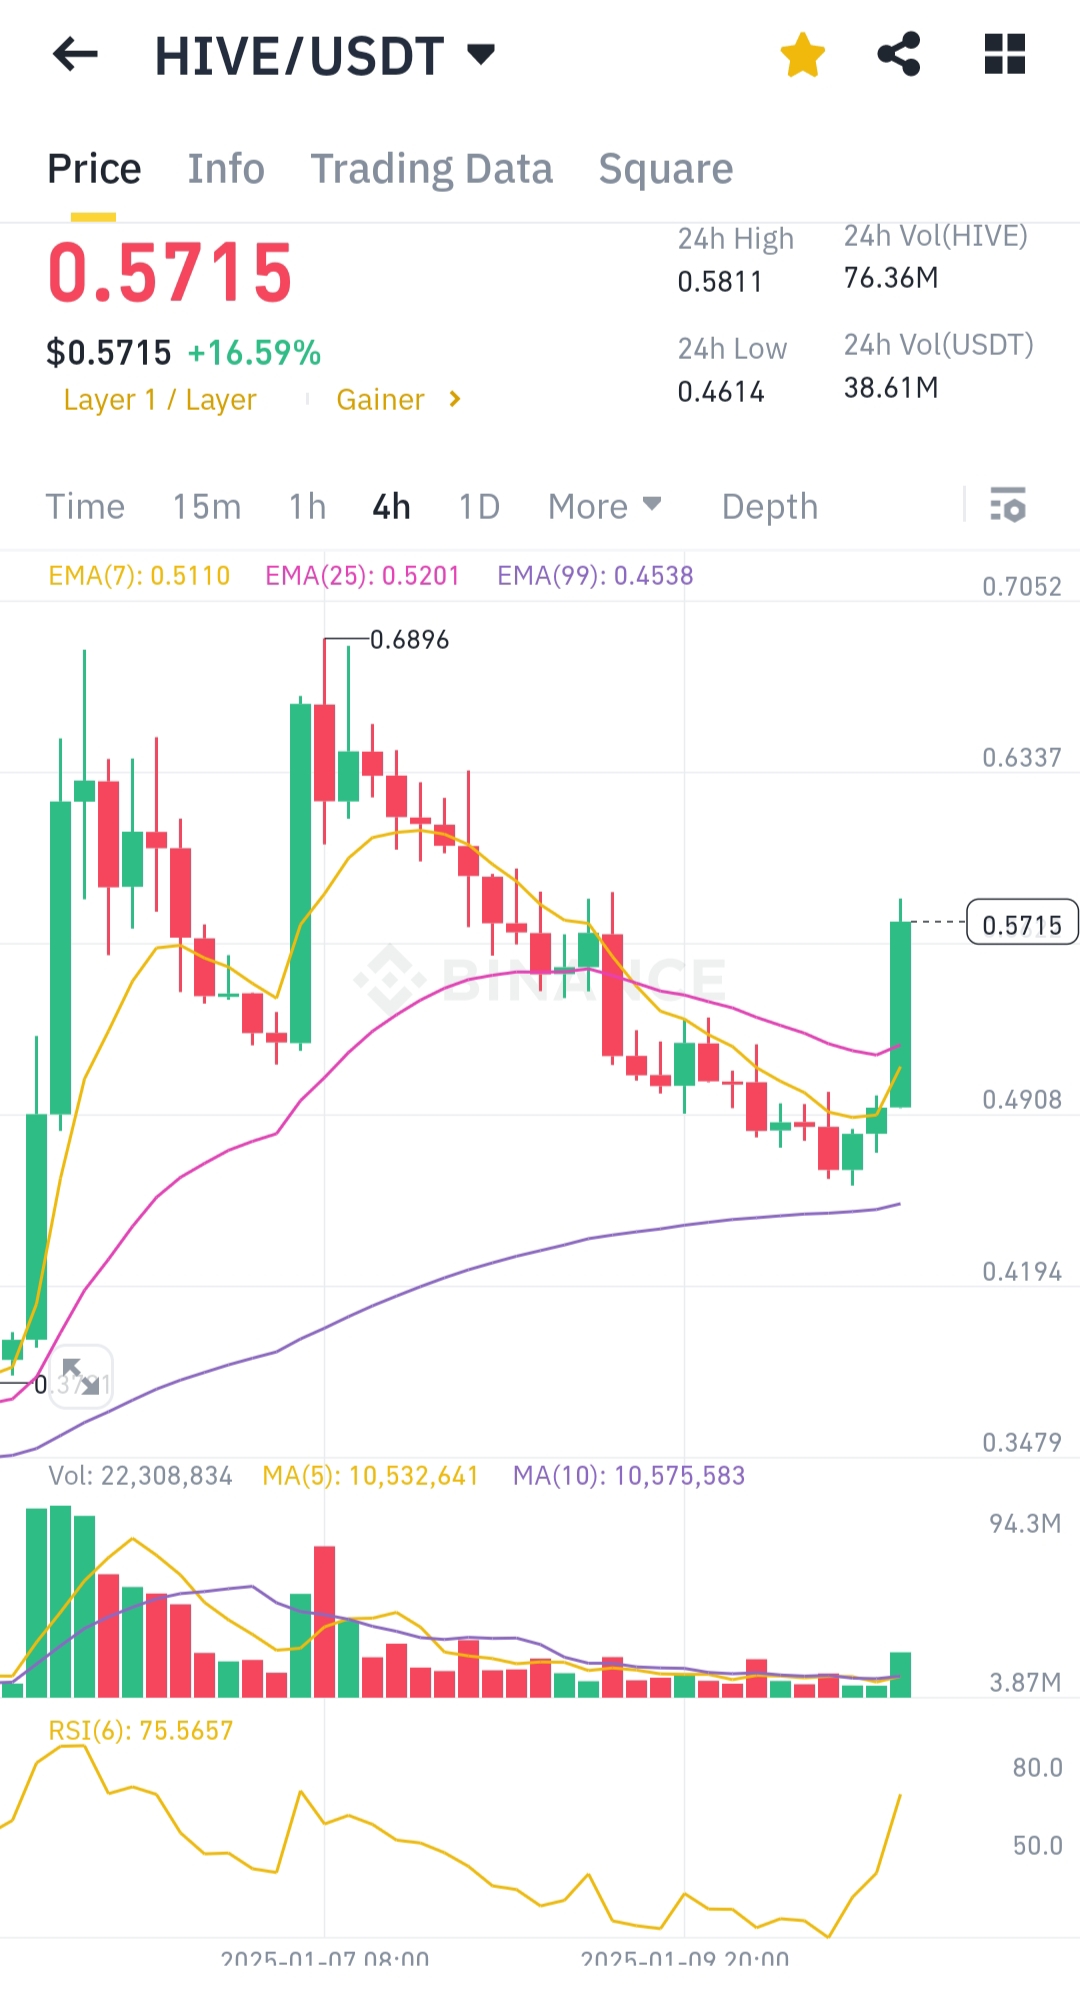
It is nice to see hive go back above $0.50. hive have been staying around 0.46 to 0.48 last few days and now suddenly pump to $0.57. is this a bull trap? Let's see what the chart say.
Technical Analysis on HIVE/USDT (4H Chart)
Price Movement and Trend:
- The price has spiked by 16.59%, currently trading at $0.5715, after bouncing from the 24H low of $0.4614.
- The chart shows a significant bullish candlestick breaking above the EMA(7) ($0.5110) and EMA(25) ($0.5201), indicating strong upward momentum.
Volume:
- A notable increase in trading volume accompanies the price surge, reflecting strong buying interest and potential continuation of the bullish trend.
Moving Averages:
- The shorter-term moving averages (EMA(7) and EMA(25)) are sloping upwards, suggesting a short-term bullish crossover.
- The EMA(99) ($0.4538) remains below the price, further confirming the upward trend.
RSI:
- The RSI(6) at 75.57 indicates the asset is currently overbought, signaling possible short-term exhaustion or correction.
Resistance and Support Levels:
- Immediate resistance: $0.5811 (24H high).
- Immediate support: $0.5110 (EMA(7)) and $0.4538 (EMA(99)).
Conclusion:
HIVE is experiencing a strong bullish breakout, but overbought RSI suggests a potential short-term pullback. Watch for resistance at $0.5811 and support at $0.5110.
You received an upvote of 22% from Precious the Silver Mermaid!
Thank you for contributing more great content to the #SilverGoldStackers tag. You have created a Precious Gem!
Another pump let hope it holds this time.