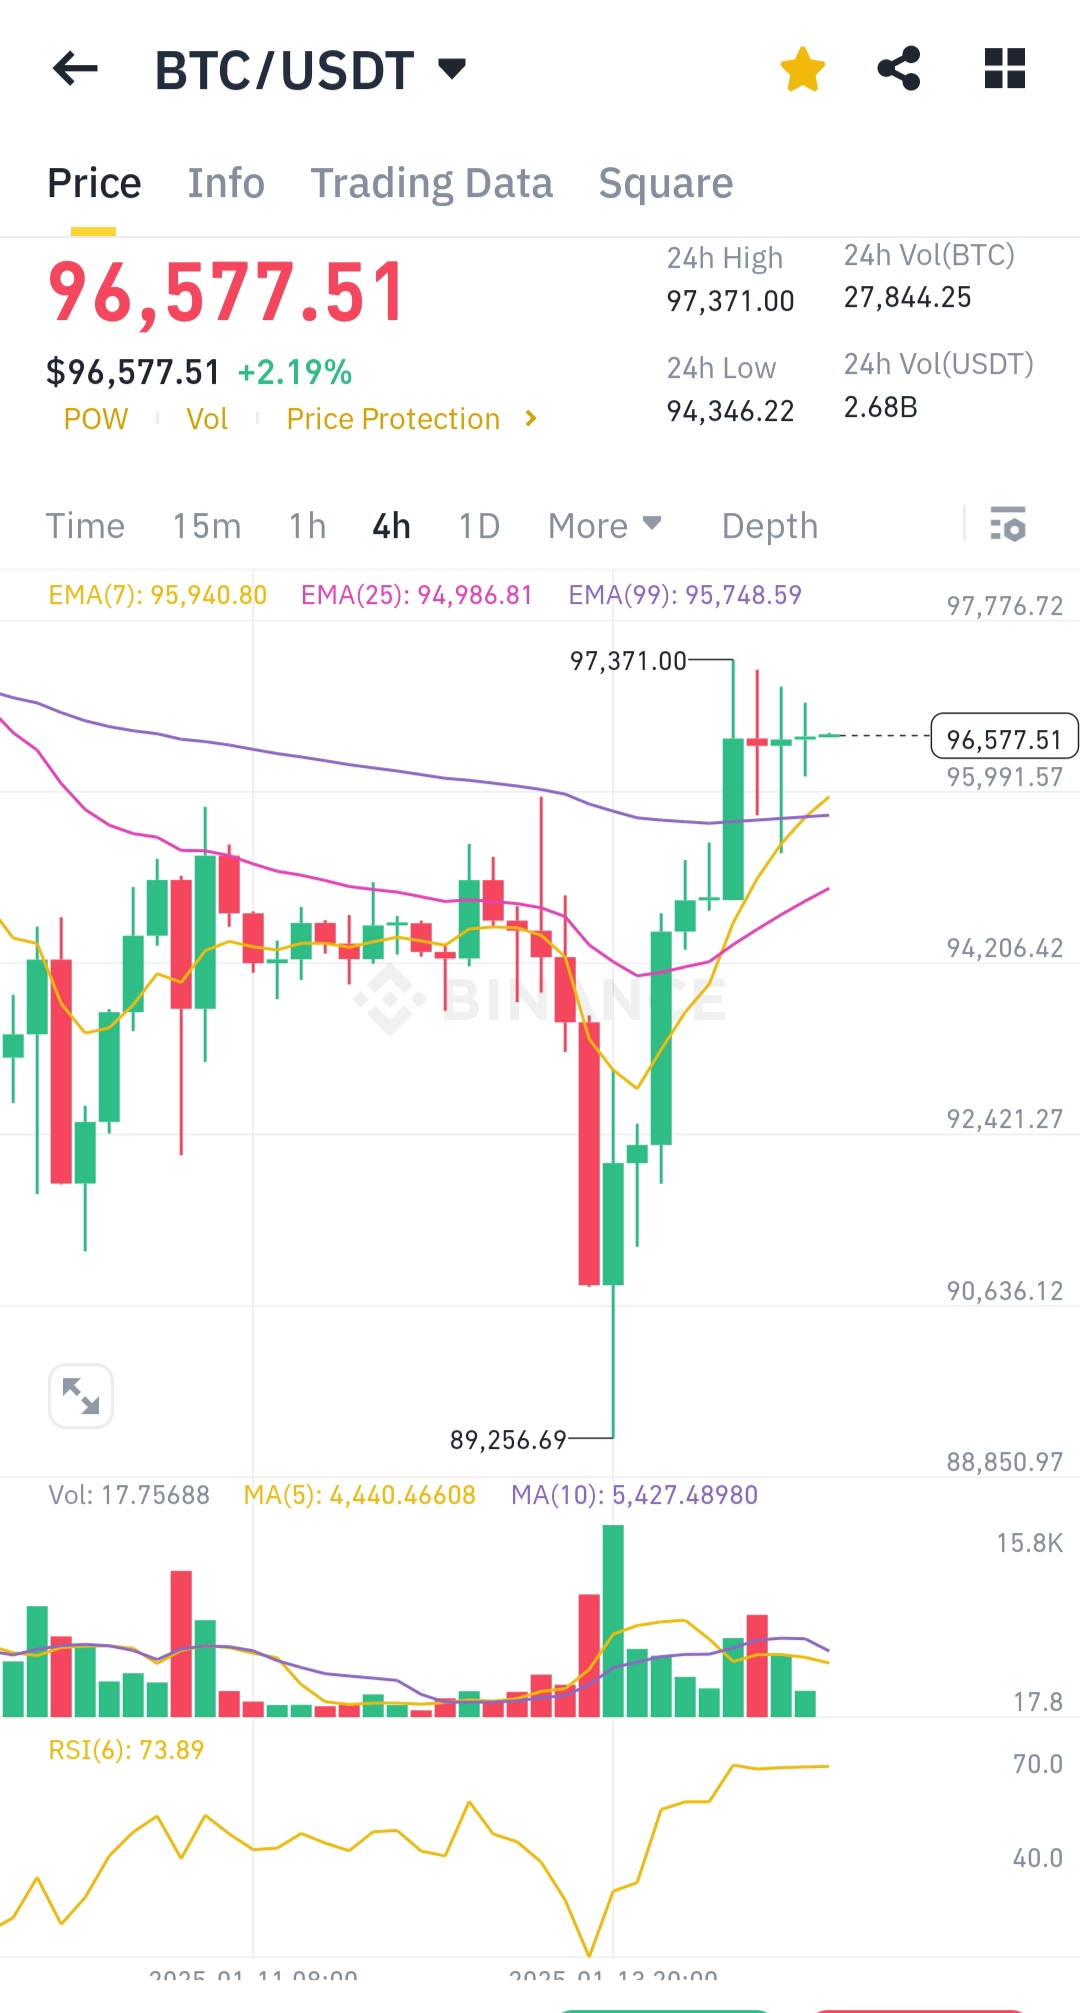
Bitcoin managed to immediately recover after briefly touch $90,000 to now $97,000. What a crazy movement of price. Let's see what the chart say.
Technical Analysis:
EMA Levels:
- EMA(7): $95,940.80
- EMA(25): $94,986.81
- EMA(99): $95,748.59
Bitcoin is trading above all EMA levels, indicating strong bullish momentum in the short to long term.
Support and Resistance:
- Resistance: $97,371 (24h high).
- Support: $94,346 (24h low), with a recent recovery from a significant dip to $89,256.
RSI:
- RSI(6) is at 73.89, entering the overbought zone. This suggests potential resistance at higher levels but also confirms strong buying pressure.
Volume:
- Increased trading volume during the recovery phase signals high market participation and confidence in the upward trend.
Moving Averages:
- MA(5) and MA(10) are rising, signaling upward momentum. The price breaking past these levels further validates the bullish trend.
Conclusion:
Bitcoin has demonstrated a strong recovery from $90K to over $96K, breaking key resistance levels and sustaining momentum. However, overbought conditions could lead to short-term consolidation or minor pullbacks.
You received an upvote of 21% from Precious the Silver Mermaid!
Thank you for contributing more great content to the #SilverGoldStackers tag. You have created a Precious Gem!