What a day for Bitcoin. Last 24 hours, we see the whole crypto market in red after the release of inflation report from US. Let's see what the chart say.
Detailed Technical Analysis of Bitcoin (BTC/USDT)
1. Trend Analysis (4-hour Chart):
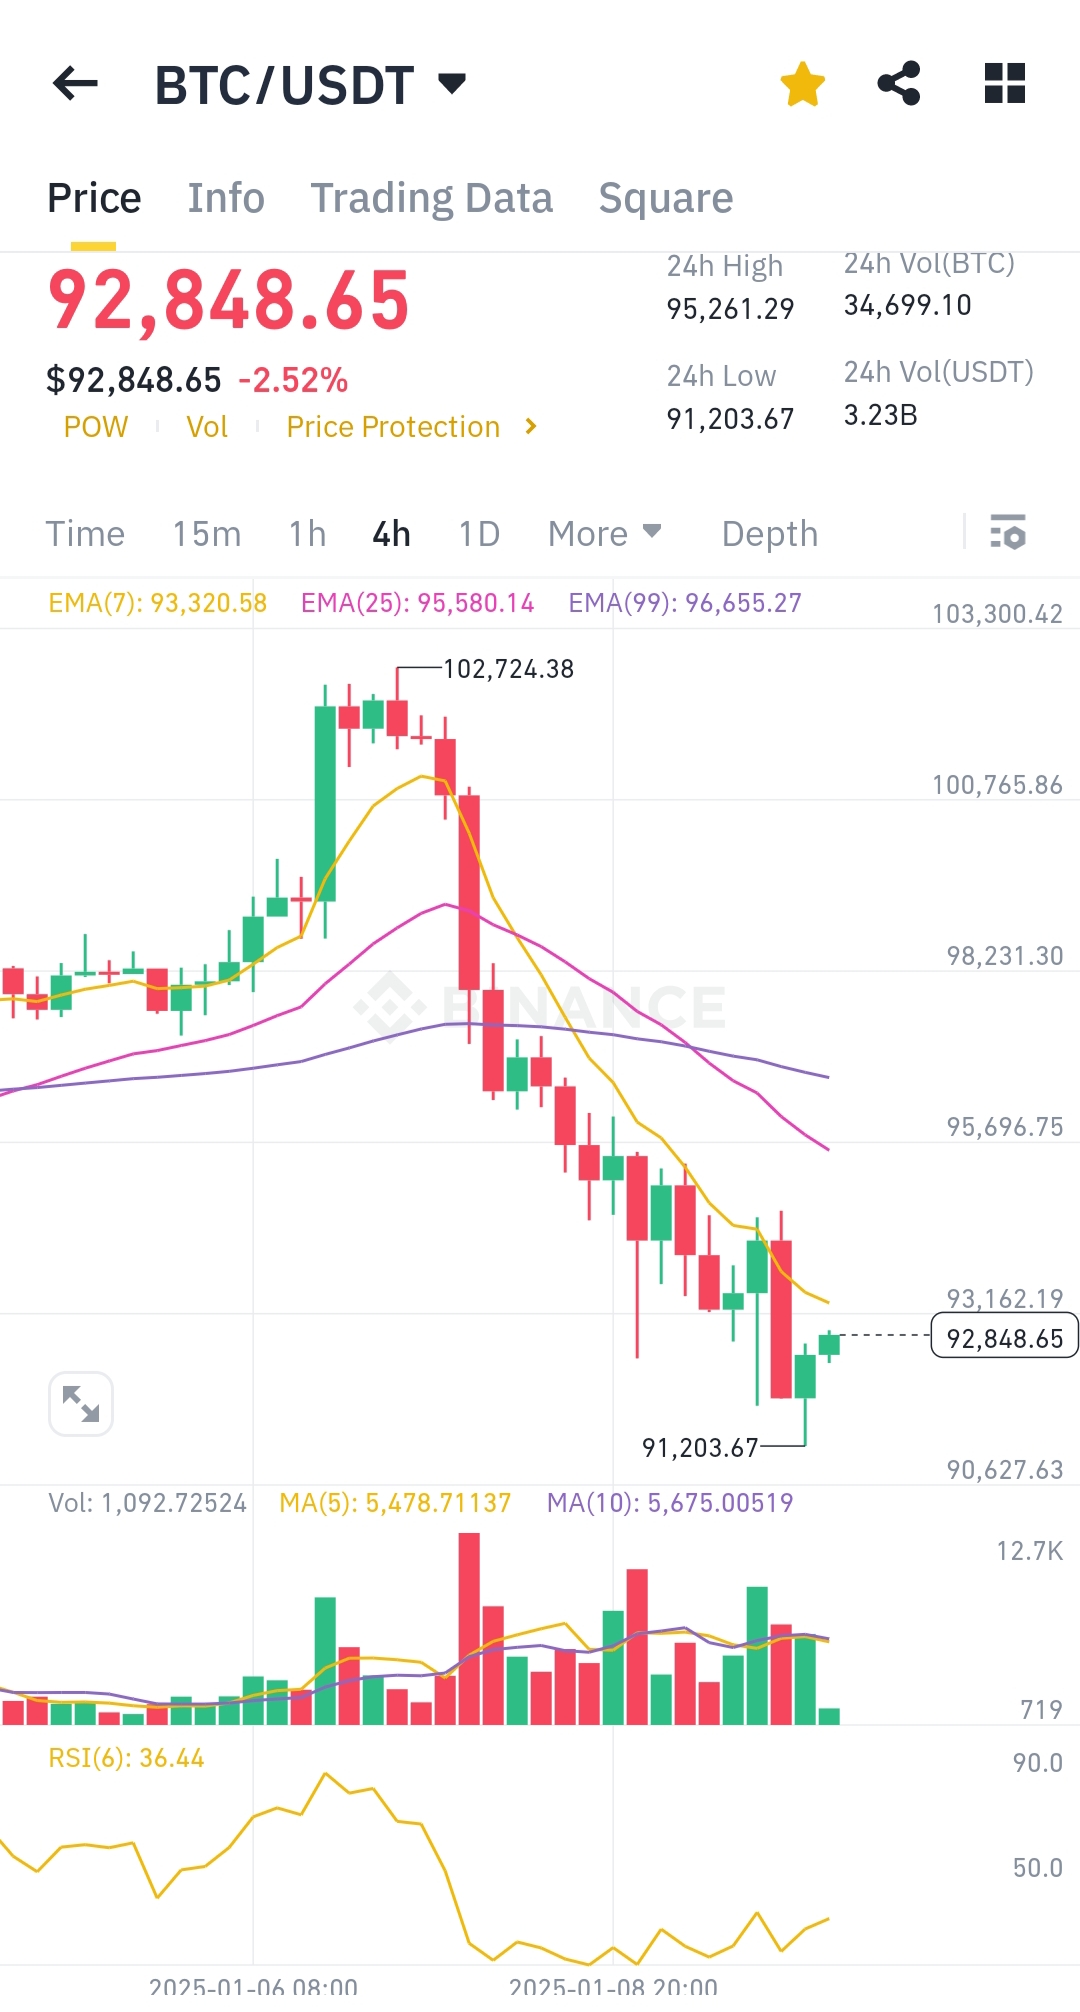
- Bitcoin is currently trading at $92,848.65, marking a 2.52% decline over the last 24 hours.
- The 24-hour high was $95,261.29, and the low was $91,203.67, indicating a wide volatility range.
- Recent candlesticks show a clear downtrend from the peak of $102,724.38.
2. Moving Averages:
- EMA(7): $93,320.58
- EMA(25): $95,580.14
- EMA(99): $96,655.27
The price is trading below all key EMAs, signaling strong bearish momentum.
3. RSI (Relative Strength Index):
- Current RSI(6): 36.44
This places RSI in the oversold zone, suggesting potential buyer interest but no immediate reversal signs.
4. Volume Analysis:
- Volume is gradually declining, indicating weak follow-through on recent price actions.
- Bearish momentum lacks strong support from high volumes, hinting at a potential slowing of the downtrend.
5. Support and Resistance Levels:
- Immediate Support: $91,203.67 (recent low)
- Next Support: $90,627.63
- Immediate Resistance: $93,162.19 (previous consolidation level).
Breaking above $93,162 could signal a temporary relief rally.
6. Key Observations:
- Bitcoin broke below significant support at $95,580, confirming bearish sentiment.
- Multiple rejections at higher EMAs suggest sustained selling pressure.
- A weak RSI might attract short-term buyers, but the macro trend remains bearish.
Conclusion:
Bitcoin remains in a bearish phase with limited signs of recovery. Traders should monitor the $91,203 support level for breakdowns or reversals.