Last 24 hours we need Bitcoin nearly reach $103,000 and get rejected. Now it is at $97,000. Will it be able to test it again or go down further? Let's see what the chart say.
Detailed Technical Analysis on BTC
1. Price Action
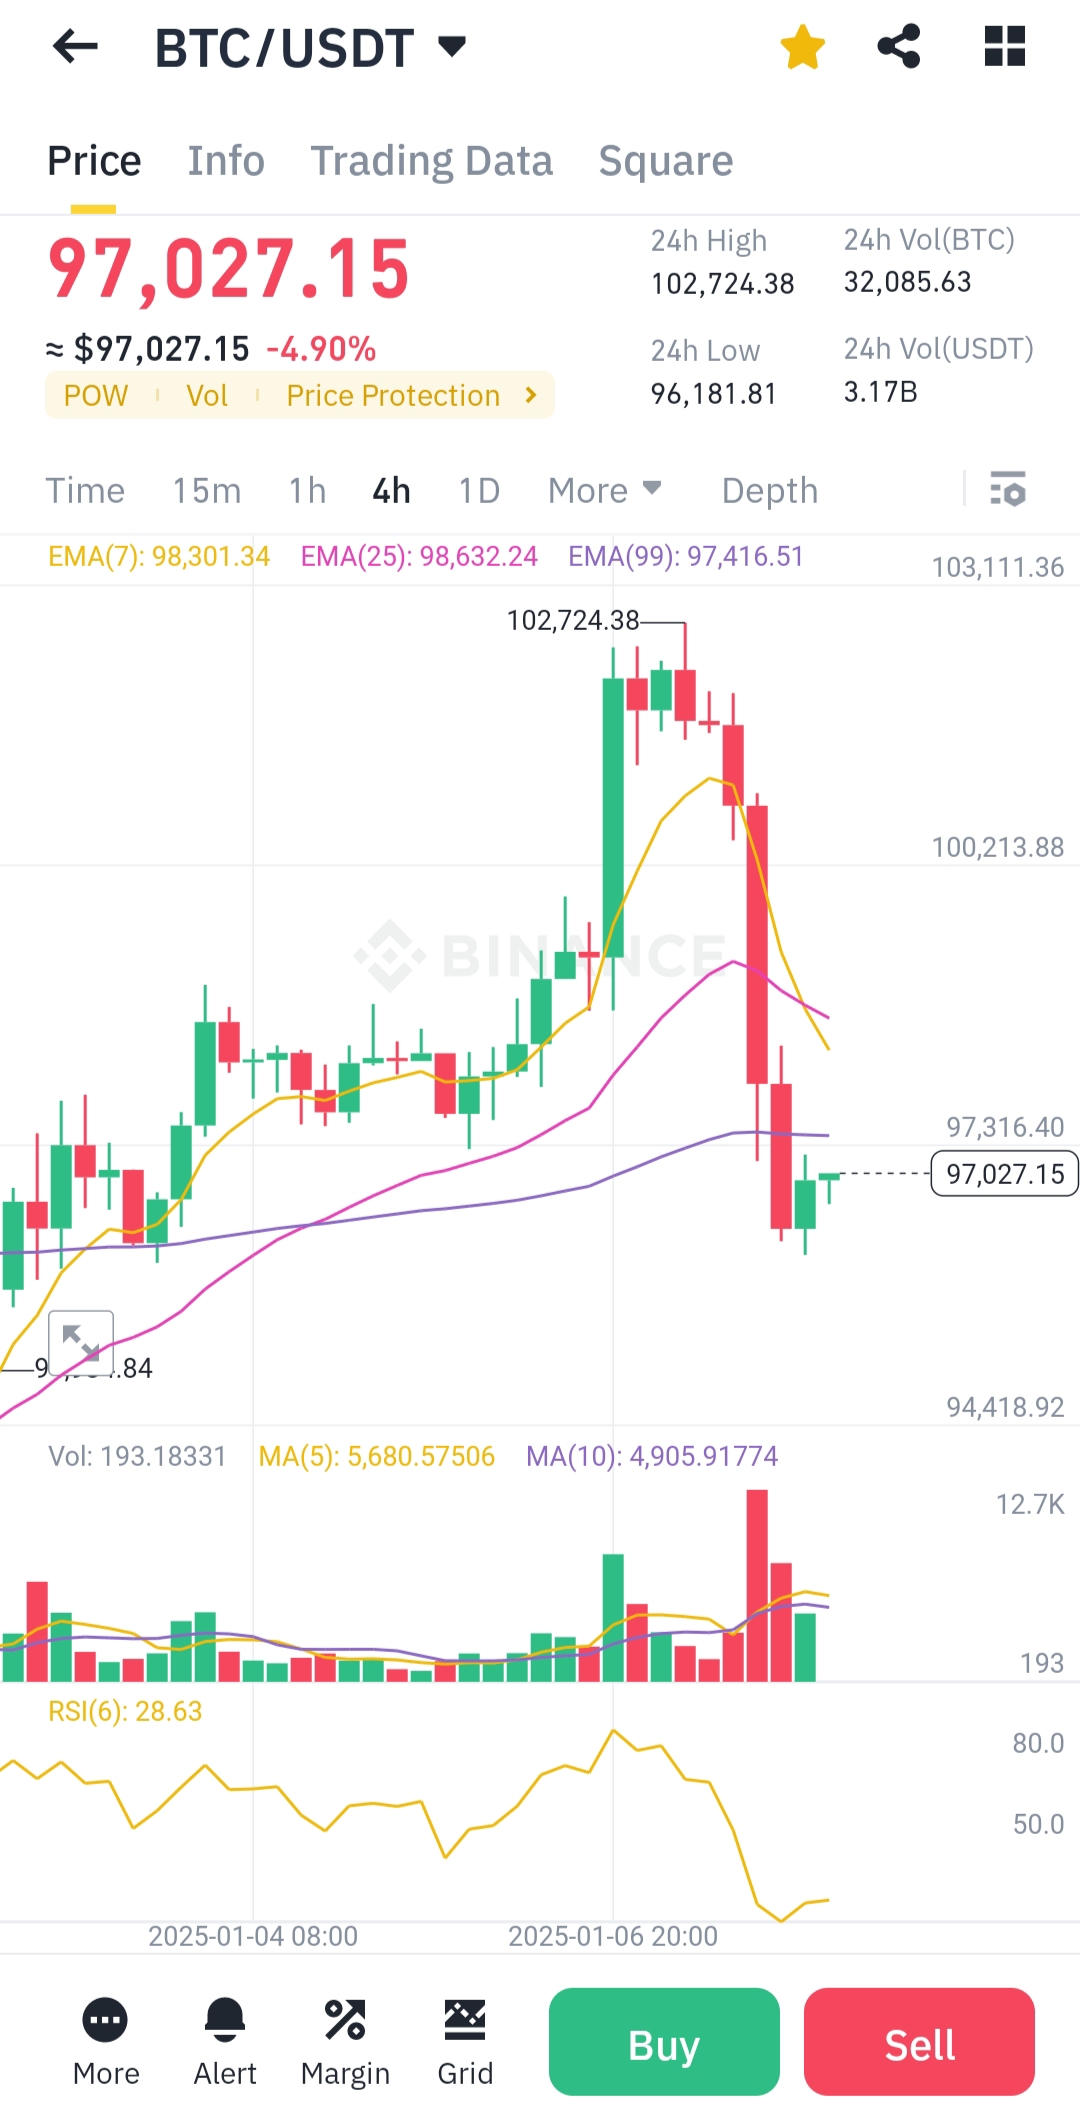
- Bitcoin's price has dropped by 4.90%, currently trading at 97,027.15 USDT.
- A bearish trend is evident following the peak at 102,724.38 USDT, suggesting strong selling pressure.
2. Moving Averages
- EMA(7): 98,301.34 (short-term trend shows bearish momentum).
- EMA(25): 98,632.24 (indicates bearish crossover with EMA(7)).
- EMA(99): 97,416.51 (acts as immediate resistance, price is trading slightly below it).
3. Support and Resistance
- Resistance Levels:
- Immediate: 97,416 (EMA 99).
- Higher: 100,213.88 (recent high).
- Support Levels:
- Immediate: 96,181.81 (24-hour low).
- Stronger: 94,418.92 (previous consolidation zone).
4. Volume
- Volume shows a spike during the recent sell-off, signaling a strong bearish breakout.
5. RSI (Relative Strength Index)
- RSI(6): 28.63 (oversold zone, potential for a minor rebound).
Conclusion
Bitcoin is currently in a bearish trend with the possibility of a short-term bounce due to oversold RSI levels. Watch for a break above EMA(99) to confirm reversal or a drop below 96,181 for continuation of the downtrend.
You received an upvote of 15% from Precious the Silver Mermaid!
Thank you for contributing more great content to the #SilverGoldStackers tag. You have created a Precious Gem!