Last 24 hours we see BTC touch $90,000 and than it recover back to $94,000. Is it a bad sign for BTC? Let's see what the chart say.
Detailed Technical Analysis:
Price Action:
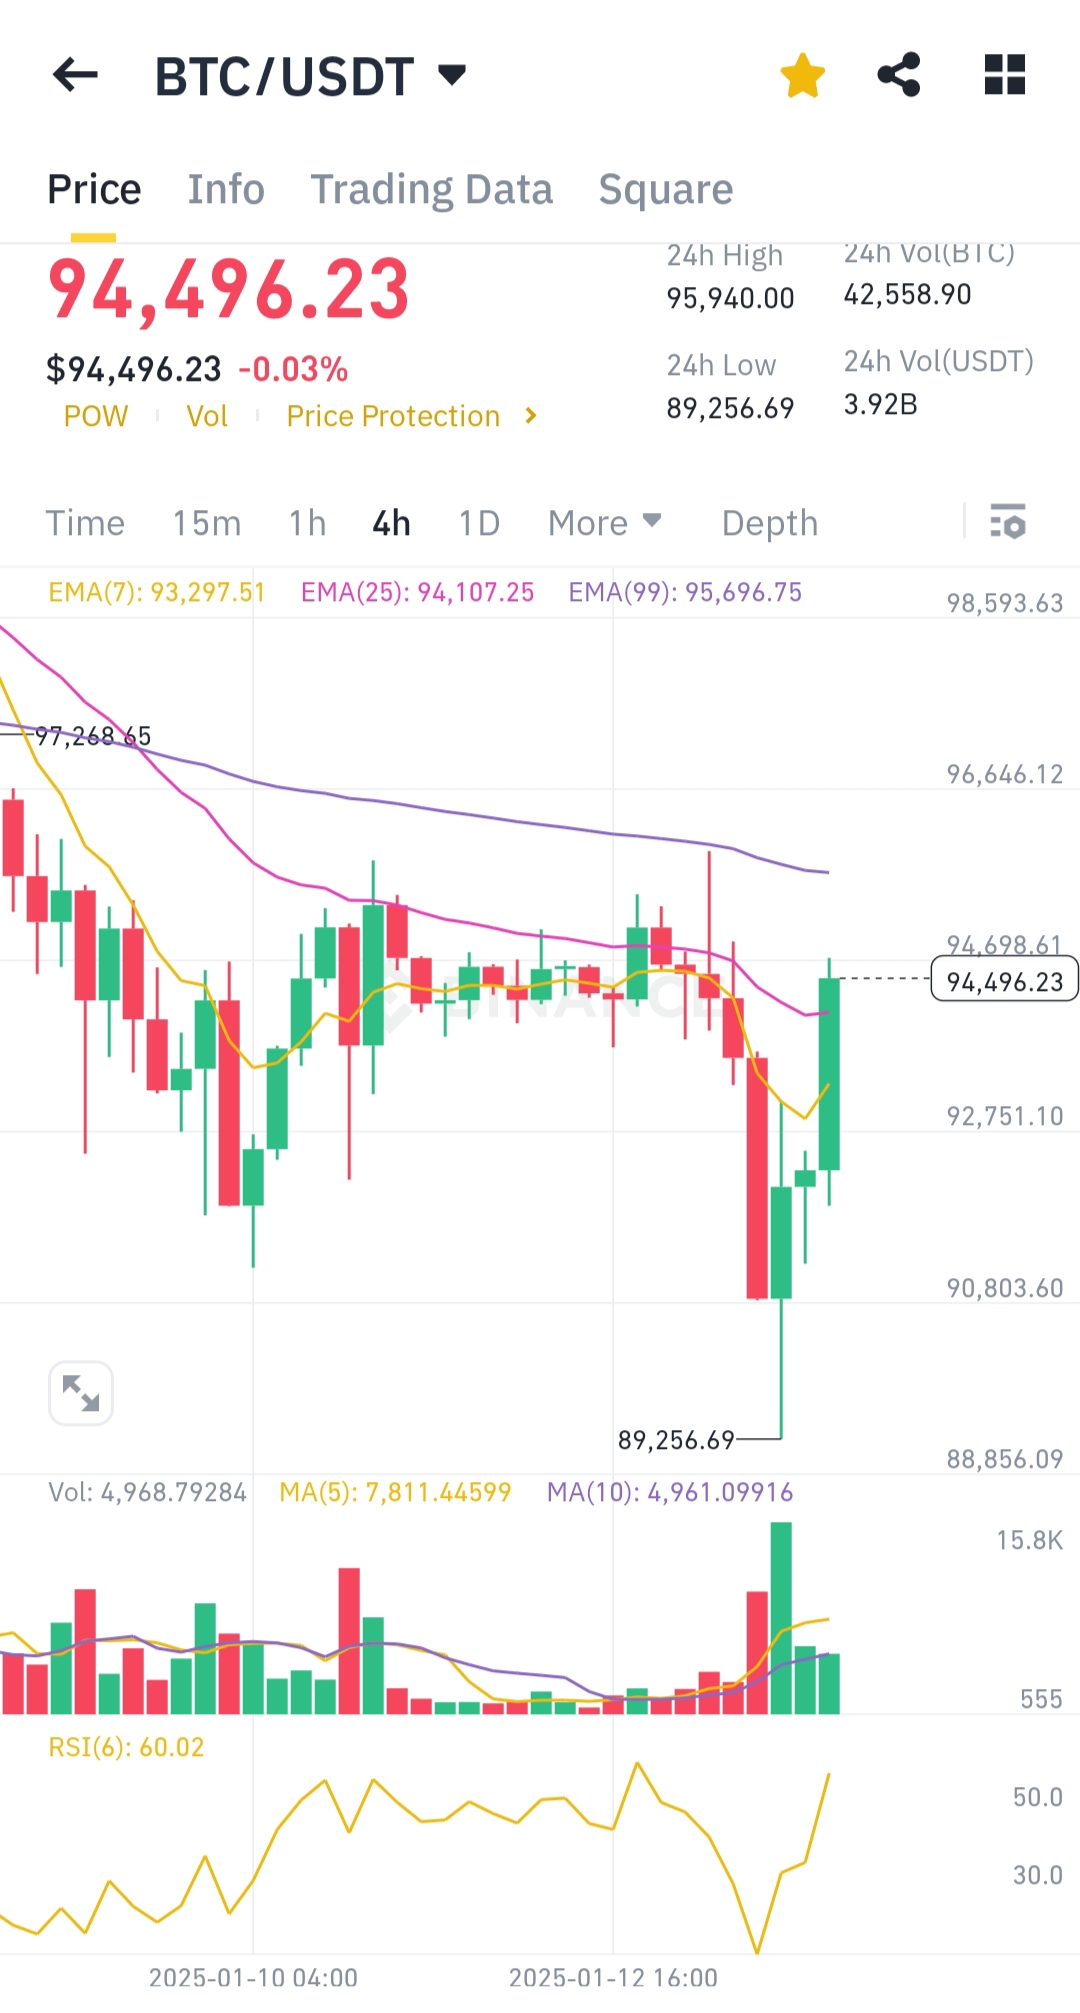
- Bitcoin tested a significant support level at $90,000, rebounding sharply to the current price of $94,496.23.
- Recent candles show strong buying pressure after a steep dip, indicating possible short-term recovery.
Moving Averages (MA & EMA):
- The EMA(7) ($93,297.51) has crossed above the price, suggesting a potential bullish shift.
- The EMA(25) ($94,107.25) aligns closely with the price, indicating consolidation near this level.
- The EMA(99) ($95,696.75) remains above, acting as resistance in the broader bearish trend.
Relative Strength Index (RSI):
- RSI(6) is at 60.02, showing recovery from oversold conditions but nearing overbought territory.
Volume:
- High buying volume confirms interest in the $90,000 level as a critical support.
Trend Outlook:
- While the rebound from $90,000 reflects strong demand, the trend remains fragile unless Bitcoin surpasses the EMA(99) resistance at $95,696.75.
Conclusion:
Bitcoin's dip to $90,000 has triggered significant market fear. The recovery indicates potential short-term upside, but broader bearish risks persist below $96,000. Stay cautious.
I can picture Bitcoin dropping 50,000 in a single day, once U.S. Crypto Coinage is Announced...