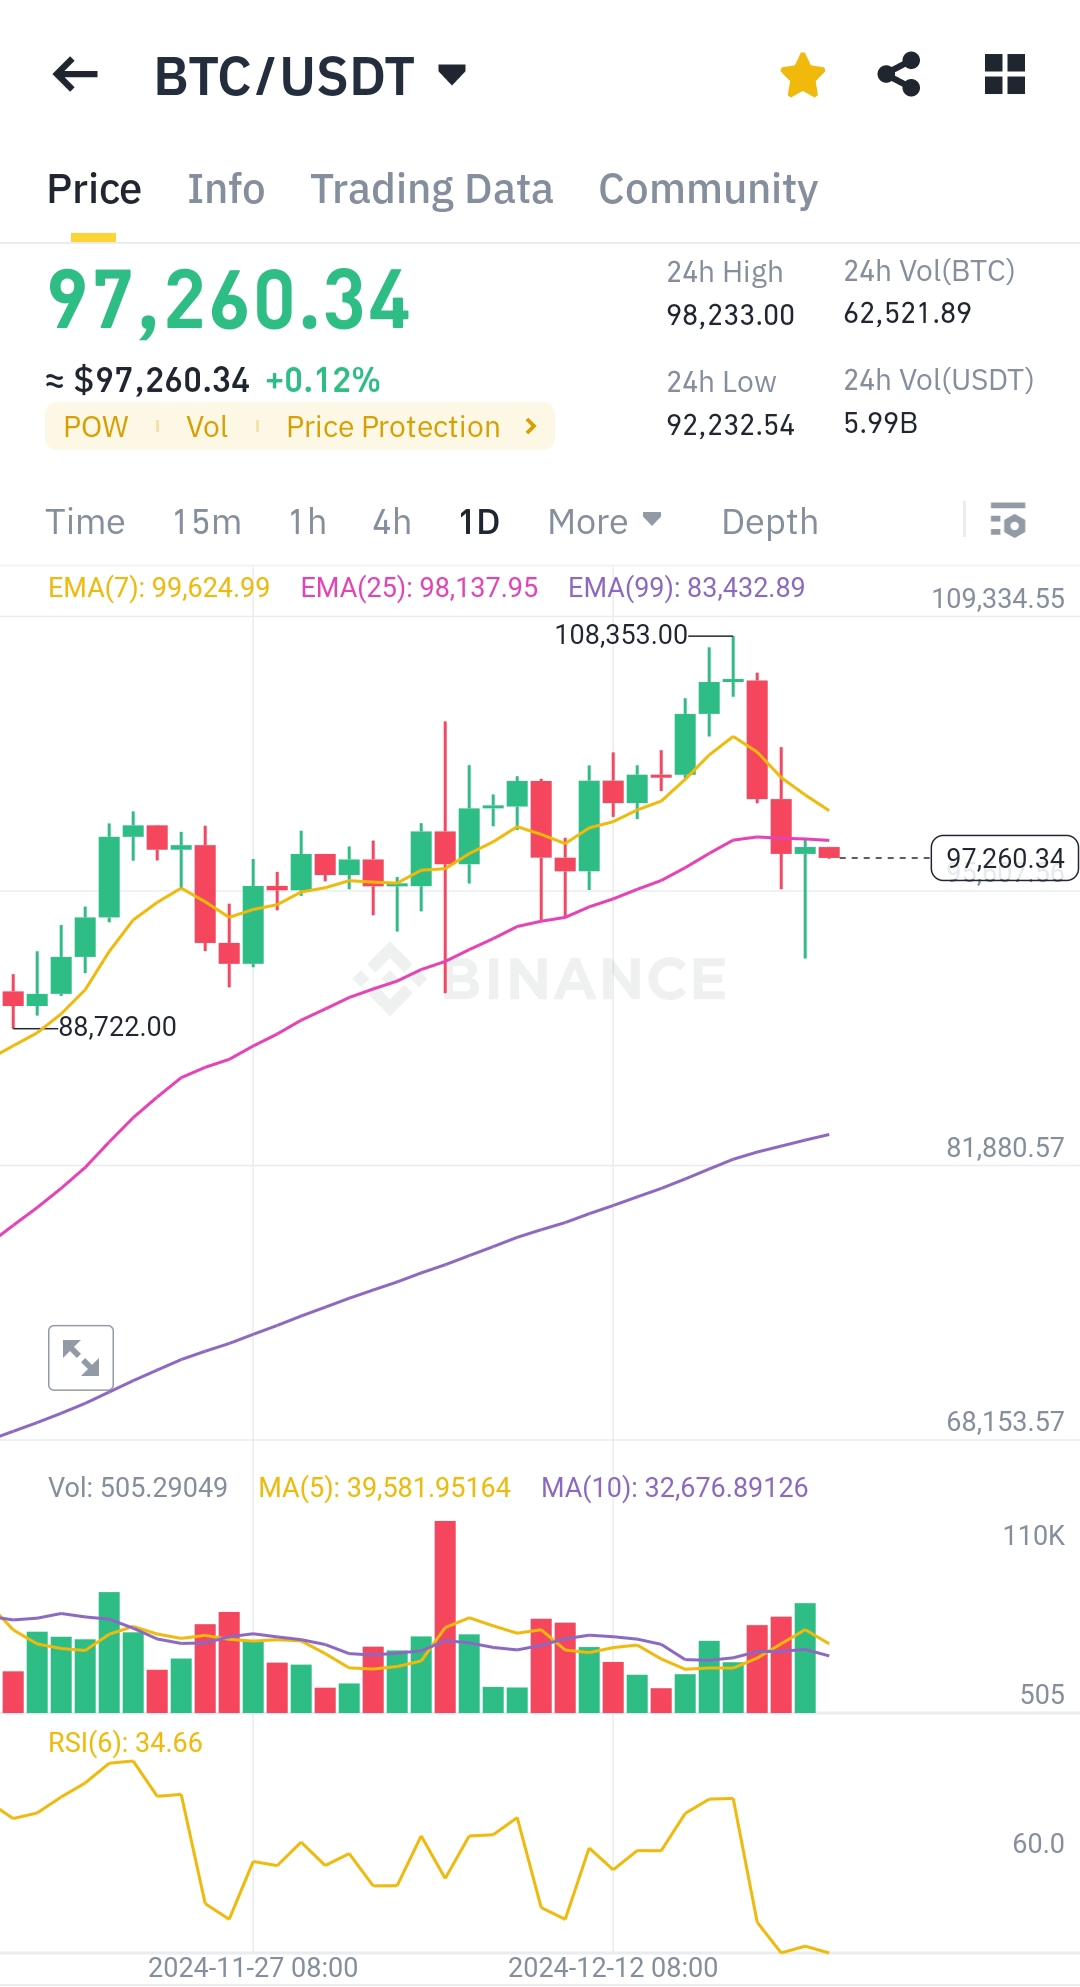
Bitcoin dump have finally stop after it touch $93,000. Is it over already or we will seeing new dump when US stock market open?
Don't forget Christmas and Chinese new year is around the corner that normally results in large sell off.
Let's see what the chart say.
1. Price Action Overview:
- Current Price: $97,260.34
- 24H High: $98,233.00
- 24H Low: $92,232.54
- BTC/USDT is showing a slight increase of +0.12%, indicating a period of consolidation after recent volatility.
2. Moving Averages:
- EMA(7): $99,624.99
- EMA(25): $98,137.95
- EMA(99): $83,432.89
The price is currently below the EMA(7) and EMA(25), suggesting short-term bearish pressure. However, the EMA(99) remains far below the current price, reflecting a strong long-term uptrend.
3. Support and Resistance Levels:
- Resistance: $99,625 (aligned with EMA(7))
- Immediate Support: $92,232 (24H low)
- Key Support: $88,722 (previous low shown on the chart)
4. RSI Analysis:
- RSI(6): 34.66
The RSI is approaching the oversold territory (below 30). This indicates potential weakening of selling pressure, and a reversal might be expected if RSI dips further and then rebounds.
5. Volume Analysis:
- Current Volume: 505.29K
- The volume histogram shows spikes in red bars (bearish volume), indicating strong selling momentum recently. A decline in bearish volume and an uptick in green (bullish) bars could signal recovery.
6. Trend Analysis:
- BTC/USDT recently failed to sustain the $108,000 level and faced rejection. The formation of a large bearish candlestick indicates a strong sell-off. The subsequent small green candle reflects indecision in the market, suggesting traders are waiting for confirmation of the next move.
7. Short-Term Outlook:
- If the price reclaims EMA(7) at $99,625, it could attempt to retest $108,000.
- Failing to hold $92,232 could lead to a drop toward the key support at $88,722.
8. Long-Term Outlook:
- The EMA(99) reflects a strong long-term bullish trend, so unless the price breaks below $83,432 (EMA(99)), the long-term bullish structure remains intact.
Conclusion:
BTC/USDT is at a critical juncture, balancing between a short-term bearish pullback and long-term bullish strength. Watch for RSI signals and volume changes as key indicators of the next major price movement.
You received an upvote of 16% from Precious the Silver Mermaid!
Thank you for contributing more great content to the #SilverGoldStackers tag.
You have created a Precious Gem!