Technical Analysis:
Current Price and Trend:
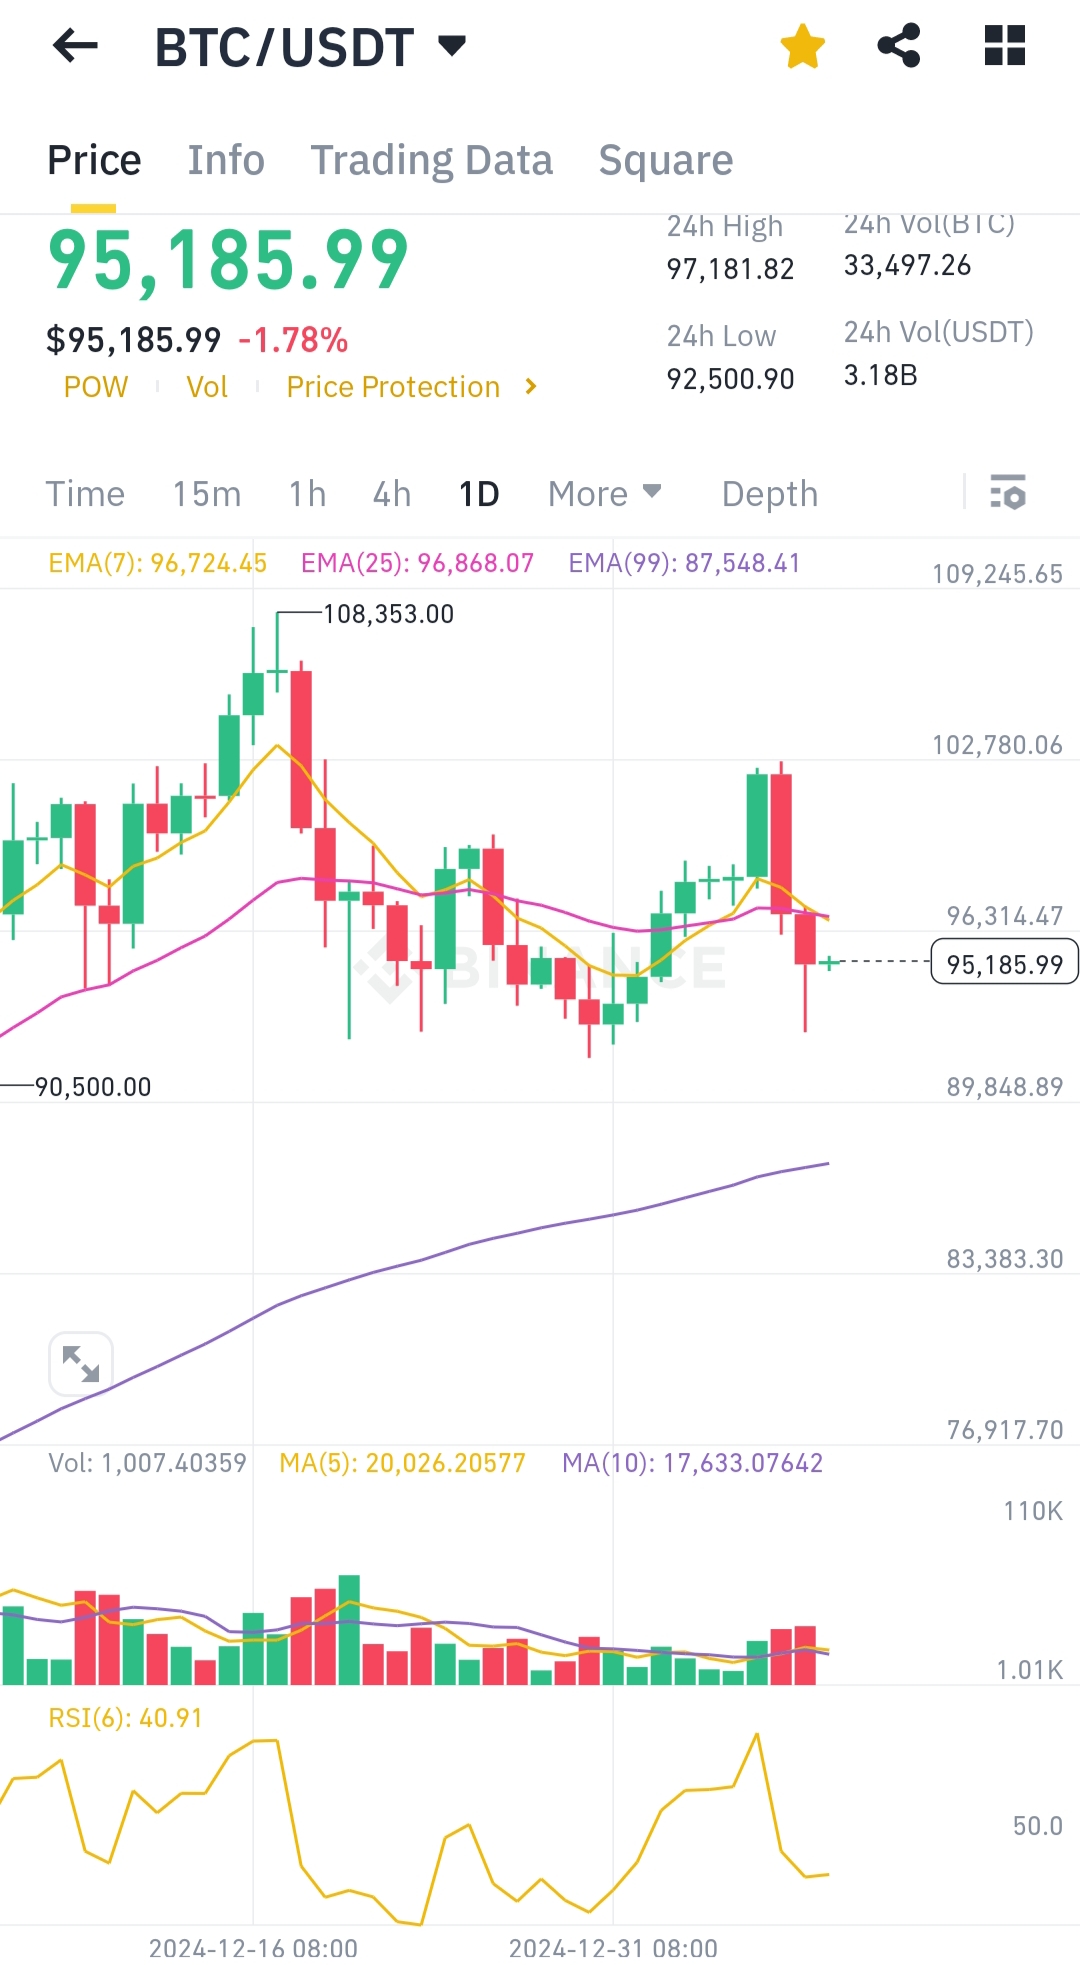
- Bitcoin is trading at $95,185.99, reflecting a -1.78% decline in the past 24 hours.
- The overall trend suggests consolidation after a previous uptrend, with current pressure from selling activity.
Moving Averages (MA):
- EMA(7): $96,724.45 - The price is trading below the 7-day EMA, indicating short-term bearish momentum.
- EMA(25): $96,868.07 - Bitcoin also struggles below the 25-day EMA, showing medium-term resistance.
- EMA(99): $87,548.41 - The price remains comfortably above the long-term EMA(99), which still supports the broader bullish outlook.
Support and Resistance Levels:
- Support: Strong near $89,848.89 (previous low).
- Resistance: Immediate resistance near the $96,300 zone, reinforced by EMA(7) and EMA(25).
Relative Strength Index (RSI):
- The RSI(6) is at 40.91, indicating bearish momentum as the value is below 50 but not yet in oversold territory.
Volume Analysis:
- Volume appears relatively low, reflecting reduced trading interest and adding to the risk of further downside movement if volume does not increase.
Candlestick Patterns:
- Recent candles show indecision followed by bearish control, suggesting a possible continuation of the pullback.
Conclusion:
Bitcoin is currently bearish in the short term, facing resistance from key moving averages and low RSI levels. A break above $96,300 is crucial for bullish recovery, while support near $89,850 must hold to prevent further losses. Traders should watch for a volume spike or significant RSI movement before taking positions.
You received an upvote of 16% from Precious the Silver Mermaid!
Thank you for contributing more great content to the #SilverGoldStackers tag. You have created a Precious Gem!