A lot of action on BTC after Trump inauguration. Let's see what the chart say.
Technical Analysis:
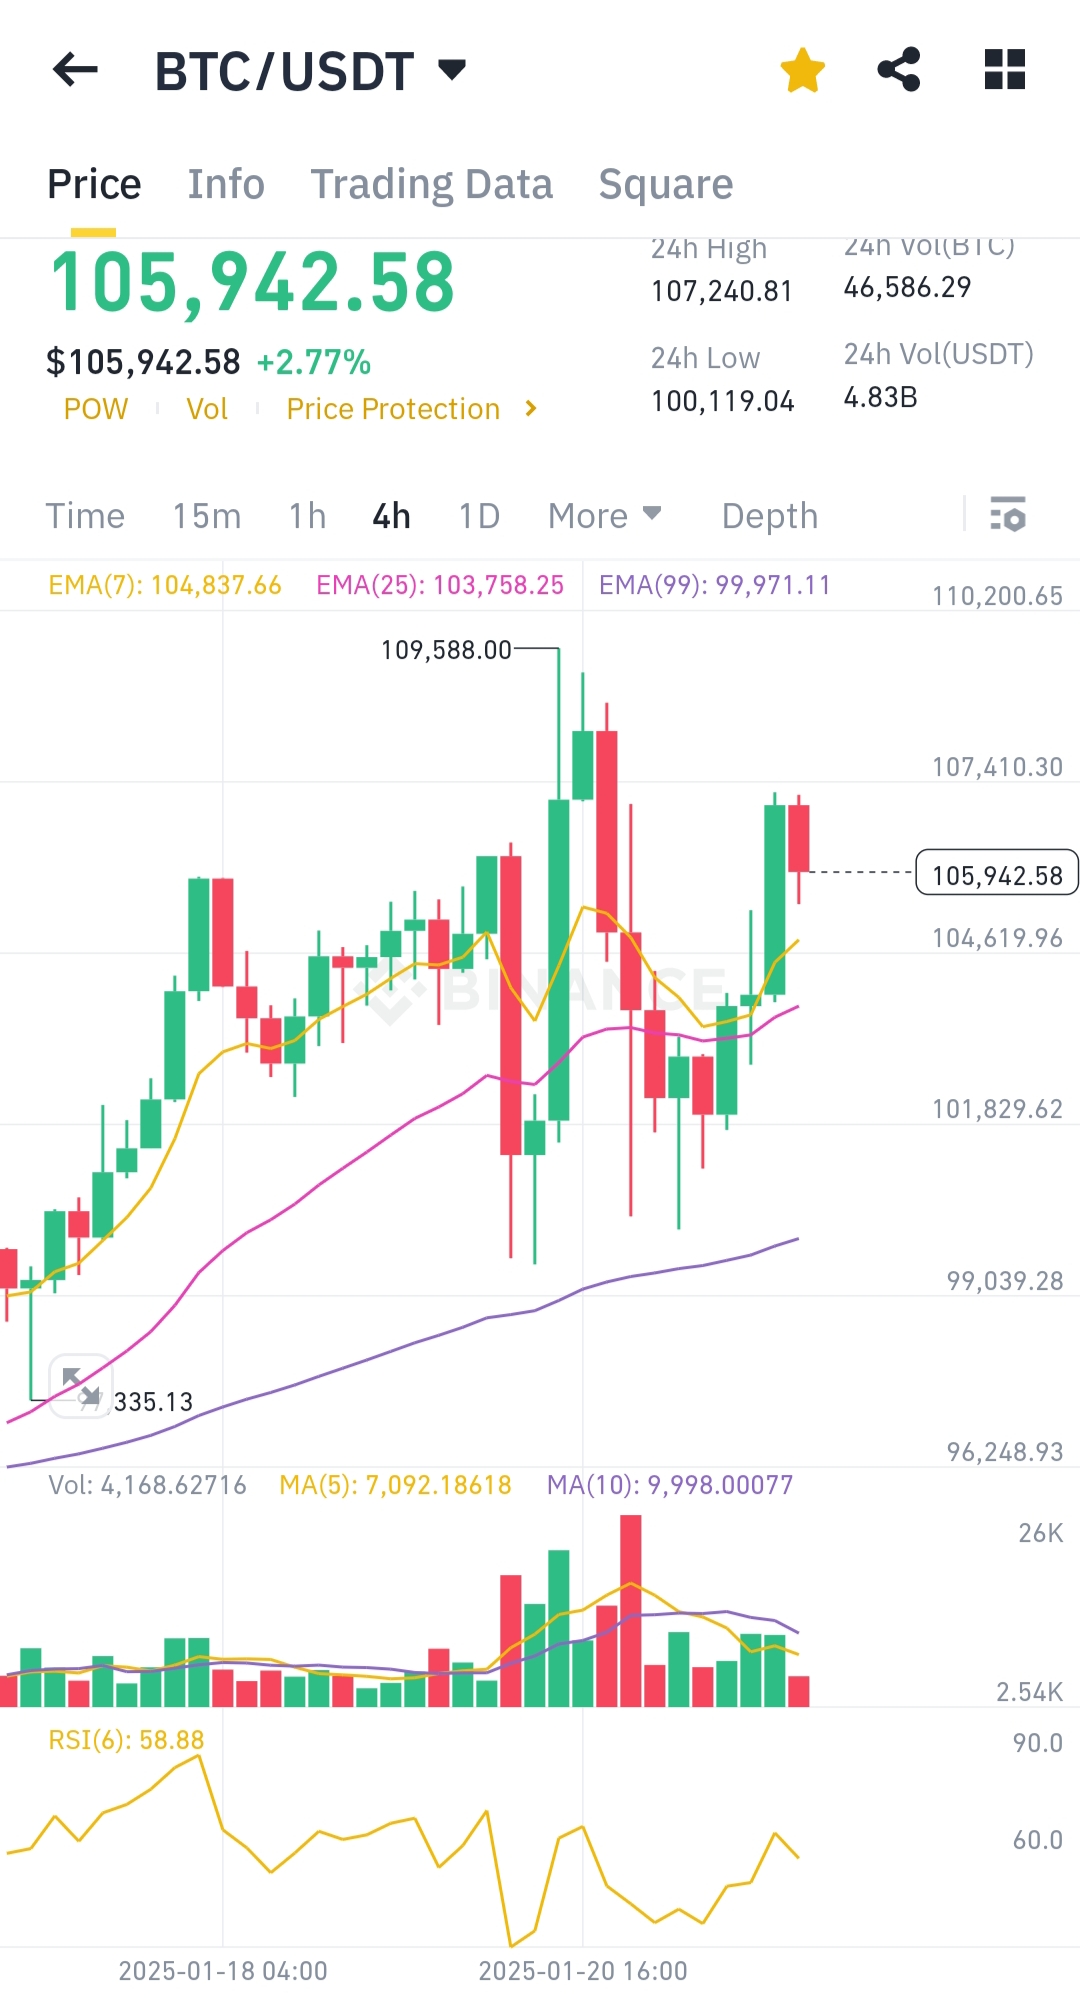
Current Price and Momentum: Bitcoin is trading at $105,942.58, showing a +2.77% gain in the last 4-hour candle. The price is slightly below the 24-hour high of $107,240.81, indicating mild resistance.
Moving Averages:
- EMA(7): $104,837.66 (yellow line, current price is above it).
- EMA(25): $103,758.25 (pink line, acting as mid-term support).
- EMA(99): $99,971.11 (purple line, long-term support).
The alignment of short-term EMAs above the long-term EMA signals an uptrend continuation.
Volume:
Volume spiked in recent sessions, reflecting increased buying interest near $100K, but has since stabilized, suggesting a potential pause in momentum.RSI (Relative Strength Index):
RSI(6) is at 58.88, indicating a neutral to slightly bullish zone, with no signs of overbought or oversold conditions.Key Levels:
- Support: $104,619.96 (near EMA(7)), followed by $101,829.62.
- Resistance: $107,410.30 (recent high) and $109,588.00 (local high).
Conclusion:
Bitcoin is in a short-term bullish trend, supported by strong EMAs and steady RSI. A breakout above $107,410 could push it higher, but a drop below $104,600 may signal a pullback.
You received an upvote of 14% from Precious the Silver Mermaid!
Please remember to contribute great content to the #SilverGoldStackers tag to create another Precious Gem.