How are you doing today? Hope everything's okay. I just felt like I had to write some more so here I am , trying to burn myself out. Everything is fine as far as I'm concerned, I'm just a little too busy and got no time to deal with anything and anyone. Finally took the time to rest and visit the beach, I enjoyed the process and took some time to revive my spirit. Now I'm here to share another part of this series though, so I won't waste your time. Let's get this started.
As promised in a previous Cartography post regarding the utilization of point data and point symbols in the design and creation of the statistical surface, this is the nineteenth part of this Introduction to Cartography series. This time I'm taking the chance to share broad information concerning the process of map symbolization by focusing on the steps and methods followed in order to represent the statistical surface with the utilization of linear symbols . We will talk about various techniques and the way linear symbols are utilized to create precise depictions of spatial data. We will also discuss various obstacles and problems that Cartographers have to overcome, so stay focused!
For those of you who are new to this blog, please keep in mind that this is an introductory series about the scientific field of creating accurate 2D depictions of our 3D world; Cartography. This basicaly means that I will keep working hard in order to provide general information in a simplified manner so that nobody gets bored and thinks about muting me while reading this blog. There's always a high chance of learning a thing or two by reading through this blog, so stay tuned!
Symbolization Problems
As explained previously in this Introduction to Cartography series, map symbolization is a very complicated process and can be a very diffcult job that demands vast amounts of theoretical knowledge related to various scientific fields. In the previous part of this series we shared technical information regarding the symbolization of volumetric data, which is a rather difficult process. Furthermore, we shared a few words about the definition of the Statistical Surface (again), and focused on the way point symbols are used in order to represent volumetric data . After mgetting familiar with the utilization of point data and point symbols concerning the design of the statistical surface for an area of interest, we are now ready to proceed with the next form of spatial data (linear data) that is utilized in the creation of the statistical surface. Let's see what we got.
All design and symbolization problems addressed in this blog refer to particular theoretical occassions where the existence of spatial and volumetric data on a surface of particular dimensions has to be represented with the utilization of linear data, and therefore linear symbols. The definition of a statistical surface, I know we have talked about this before but it is always worth mentioning. The design, construction, utilization and precise placement of linear symbols has always been used as a technique of depicting the values of spatial characteristics that refer to a surface of known dimensions. Every linear element is obviously used as a linear symbol, or as a compound of a mixture of linear symbols, that represent a value that refers to a specific set of geometrical attributes, or represent the frequency of appearance of a specific spatial element on our projection. What? In other words, information provided on the map memo board clarifies whether the user could obtain metric information that refers to qualitative or quantitative characteristics.

Linear Symbols
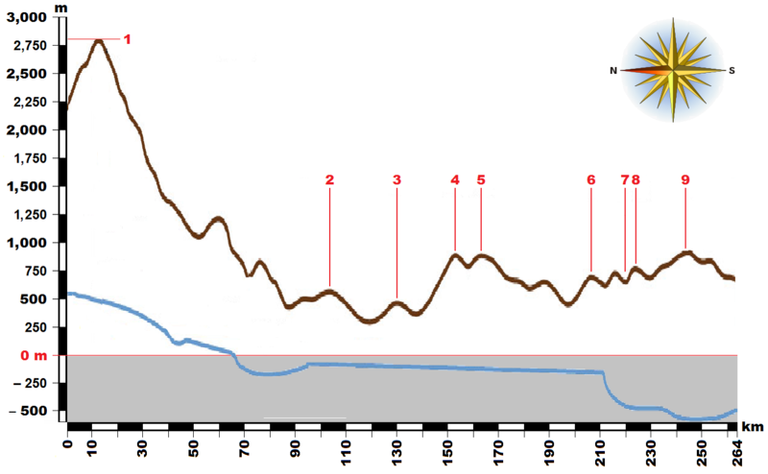
Any given statistical surface that has been designed and created with the utilization of volumetric spatial data can be characteristically described with the utilization of various tools that are mainly comprised of linear elements and in some cases even surface symbols. However, even though there are vast amounts of linear elements, or patterns created with the utilization of linear elements, that could be utilized as graphical tools in the creation of appropriate and effective symbols, there are four categories of graphical elements that are most commonly used by Cartographers nowadays: profiles, side traces, hatch patterns and equalizer lines. Profiles, side traces and equalizer lines are tools utilized in various similar methods, whereas hatch patterns are included in a wide range of different projections.
Apart from hatch patterns, all methods mentioned above can be designed and represented by a combination of parallel planes that intersect a specific surface in a unique way. The depiction of the lines drawn by the intersections of the planes and the surface of interest give birth to linear elements that are absolutely necessary in the symbolization of volumetric data with the utilization of linear symbols. It is worth noting at this point that even though hatch patterns are considered as surface symbols, they are created with the utilization of linear elements, and therefore provide Cartographers with great tools of spatial analysis when they are dealing with the representation of linear volumetric data on a statistical surface. As explained in the two previous parts of this Introduction to Cartography Series, the statistical distribution followed plays a rather significant role in the process of map symbolization.
Attributes
In all three cases of profiles, side traces and equalizer lines, the assumption that the parallel planes mentioned above are equidistant as well is made; this is a necessary requirement in most cases, however there are cases in which the planes utilized don't need to follow any rules regarding the distances between them. Those key intersections of our parallel planes and the statistical surface give birth to three different types of linear elements with different geometric attributes; profiles, side traces and equalizer lines. Profiles are represented by the intersection lines of the parallel planes and the statistical surface of interest, with the only requirement that those planes form an angle of 90 degrees with the statistical surface at any given point of the projection. This results in geometric differences between profiles and side traces, as explained below.
Side traces are depicted by the intersection lines of the parallel planes and the statistical surface of interest as well, however there's a slight difference in this case. That is, the parallel planes utilized are placed in a way that they form an angle between 0 and 89 degrees with the statistical surface. This factor induces variations regarding the geometry of the linear elements created on the map surface. And that brings us to our third linear element, known as an equalizer line. Those lines are slightly different than the previous two categories mainly due to the fact that the parallel planes' orientation changes significantly in this case. Our parallel planes are placed parallel to the statistical surface, which results in an orthogonal projection of the intersection lines on the map surface. It is all about geometry, and as I pointed out numerous times in this series, it is definitely all about the way the human sensory system works. Thanks for having me.
Alright people, that's all for today. We have officially reached the end of the nineteenth part of this Introduction to Cartography series. I don't know when this is going to end, in the beginning I didn't think I'd make so many parts but now I feel like there's a lot more to come. We have a long way to go, so sit tight. Thanks for taking the time to read this and as always, please do let me know if you have any questions regarding my work in the comments below. More Cartography and Geology stuff coming out within the next days, so stay tuned and follow me for more Engineering blogs!
PREVIOUS PARTS OF THE SERIES:

IMAGE SOURCES:
REFERENCES:
University Textbooks & Course Lectures:
- Χαρτογραφία Ι/ Cartography I -TSOULOS(National Technical University of Athens, School of Rural & Surveying Engineering, Course Lecture Notes)
Internet Links:
https://help.rockware.com/rockworks17/WebHelp/maps_2d_symbols.htm
http://webhelp.esri.com/arcgisdesktop/9.3/index.cfm?TopicName=Ways_to_map_quantitative_data
https://prism.ucalgary.ca/bitstream/handle/1880/45758/2001-693-16.pdf?sequence=2&isAllowed=y


Hope the beach was good! Glad to see more cool map making posts by you here! Cheers!
It was okay mate! Thanks for your kind words!
Thank you and cool post! Looking forward to more maps!
This post has been voted on by the steemstem curation team and voting trail.
There is more to SteemSTEM than just writing posts, check here for some more tips on being a community member. You can also join our discord here to get to know the rest of the community!
Thank you so much :)
I upvote u sir.. Please upvote and follow me.
https://steemit.com/physics/@ashish4srk/why-are-space-rockets-usually-launched-from-west-to-east
Source
Leaving comments asking for votes, follows, or other self promotional messages could be seen as spam.
More Information:
The Art of Commenting
Comment Classifications
That's probably the best way to get flagged, however I'm a special kind of person. :) Just don't go around doing this.
And don't talk to me unless it's about science. (Kidding :P)
Congratulations! This post has been upvoted from the communal account, @minnowsupport, by lordneroo from the Minnow Support Project. It's a witness project run by aggroed, ausbitbank, teamsteem, theprophet0, someguy123, neoxian, followbtcnews, and netuoso. The goal is to help Steemit grow by supporting Minnows. Please find us at the Peace, Abundance, and Liberty Network (PALnet) Discord Channel. It's a completely public and open space to all members of the Steemit community who voluntarily choose to be there.
If you would like to delegate to the Minnow Support Project you can do so by clicking on the following links: 50SP, 100SP, 250SP, 500SP, 1000SP, 5000SP.
Be sure to leave at least 50SP undelegated on your account.
Hi @lordneroo!
Your post was upvoted by utopian.io in cooperation with steemstem - supporting knowledge, innovation and technological advancement on the Steem Blockchain.
Contribute to Open Source with utopian.io
Learn how to contribute on our website and join the new open source economy.
Want to chat? Join the Utopian Community on Discord https://discord.gg/h52nFrV