As I'm typing this, the latest version of the simulation is happily churning along in Python 3.7 (Spyder), but that's not how I started out.
A Random World History Simulator
- Part 1
- Part 2 (current)
Excellent Programming
The first version of this simulator was built in Excel VBA. Now, I'm not going to say this was a wise choice, or the best choice, I'm only going to explain the two reasons that led a very, very, noob programmer like me to gravitate to Excel for the experiments with programming I've been doing over the past year (most of which were more of those half-finished projects I mentioned in Part 1):
The documentation available for Excel VBA is both excellent, and accessible in a way no other programming documentation I've come across is. For pretty much anything a noob programmer might want to do in Excel VBA, you can find a clear and concise explanation or tutorial that does not require any previous knowledge of programming to understand. It probably isn't the best place to learn programming as a thing in its own right, but if you just want to do something, like I did, the amount of official and unofficial documentation available is truly empowering like few platforms are.
Excel comes with a built-in platform for understanding what your program is doing, why, and how. It can be difficult, if you're not yet used to it, to understand what a piece of code is doing and why on a practical level. Functions and arguments and variables are very abstract things, and can be hard to translate to a practical result. Starting in Excel VBA gives you an easy answer: what you have is spreadsheets, and what your code does is manipulate those spreadsheets. For me, my first programming projects weren't about "I want to create a program that does X", but more in the line of "I want to generate a spreadsheet that shows X". A more modest, but therefore easier to comprehend goal.
So, with that out of the way, and hopefully any experienced programmers still with us and not leaving out of disgust (forgive me, I've tried to improve over the course of this project), let's get to the actual business of building the simulation.
Right out of the gate, I had two issues to solve. Because, the simulation as described in the article (see Part 1), does two things which simply could not be applied to the fictional world maps I wanted to run the simulation on. One was that my fictional world maps did not necessarily have a steppe climate near which to seed military technology. The other was that the simulation assumes a historical spread of agriculture based on Earth history, which is not otherwise modeled.
For the former, I decided that instead of spreading from a specific region with a specific climate, military technology would be discovered randomly through conflict, and thus spread from regions with high conflict to regions with low conflict.
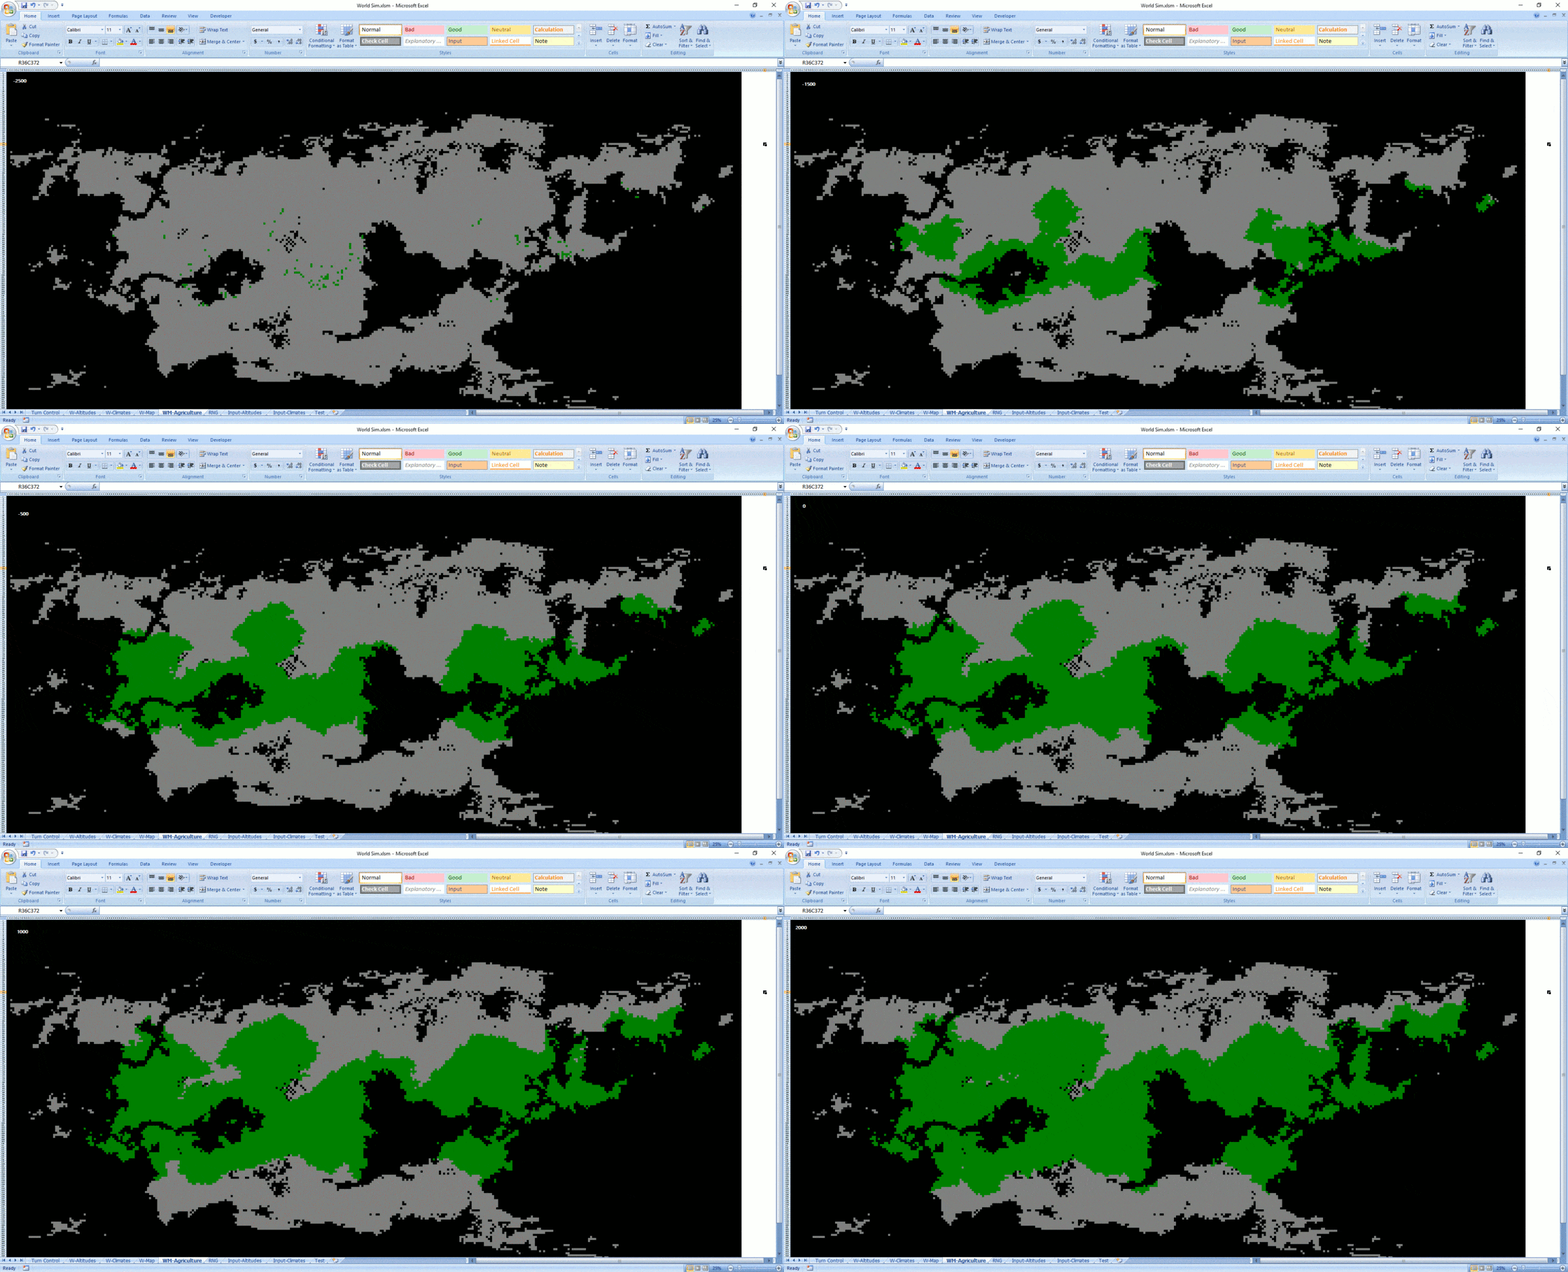
For the latter, I decided to choose one climate, Tropical Shrubland, and posit it as the biome where agriculture first develops, and spread agriculture from there. I have no scientific basis for this. The decision for Tropical Shrubland was made simply because it was a hot, humid, and relatively rare biome in my starting maps. I follow the lead of the article in assuming that agriculture spreads slower in colder climates.
The agricultural spread was the first thing I simulated, and thus has the very earliest gif of the sim that I saved:
You may recognize the world as the same one I showed in Part 1:
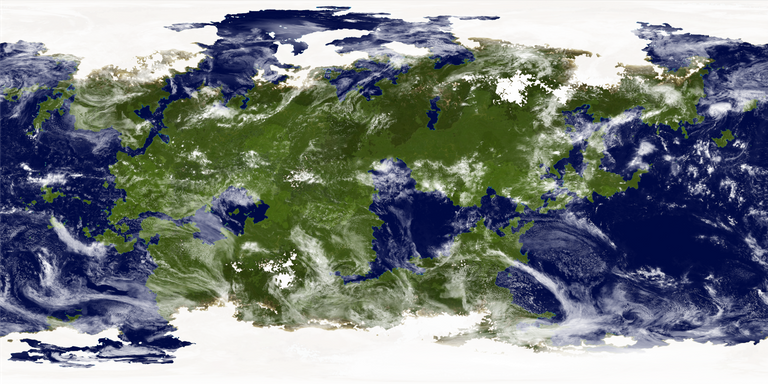
The process of turning these detailed worldmaps into sim-maps is fairly straightforward. I take both a height map and a climate map, and shrink them down to their longitude and latitudes, so each tile is 1° longitude by 1° latitude. Thus, the result is a rectangular map of 360x180 tiles, with each tile having a single climate and a single height value. Map projection issues are ignored, at least for any current version of the simulation.
The colored climate map of this world looks as follows:
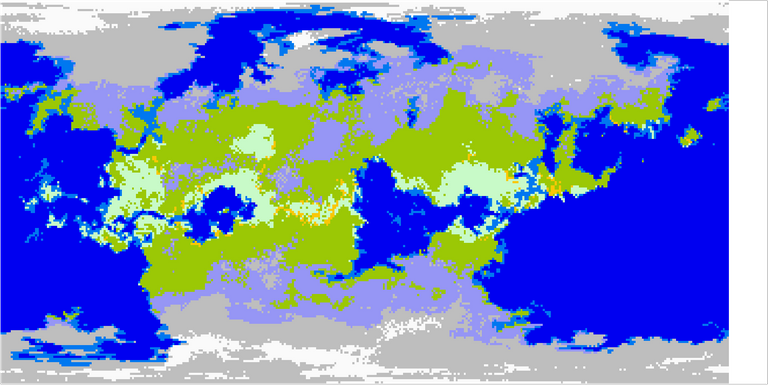
You may notice that there's white space and a partial border in the image above. That is an artifact of how Excel, in the end, truly is not designed to be used for something like this, and doesn't really work for it. Exporting images from Excel is a bit of a makeshift process, the whitespace and borders being the result of that.
But, at this stage, my goal is simply to see if I'm actually able to create this sim, and turn it into the kind of sim I want to make. Getting a proper code-base (Python) will come after.
Pop Goes the Polity
Regrettably, I did not keep all that many visual results from my early work. And with Excel being what it is, it's non-trivial to try and reproduce what happened. So my apologies that my images may not always exactly fit the process I'm describing.
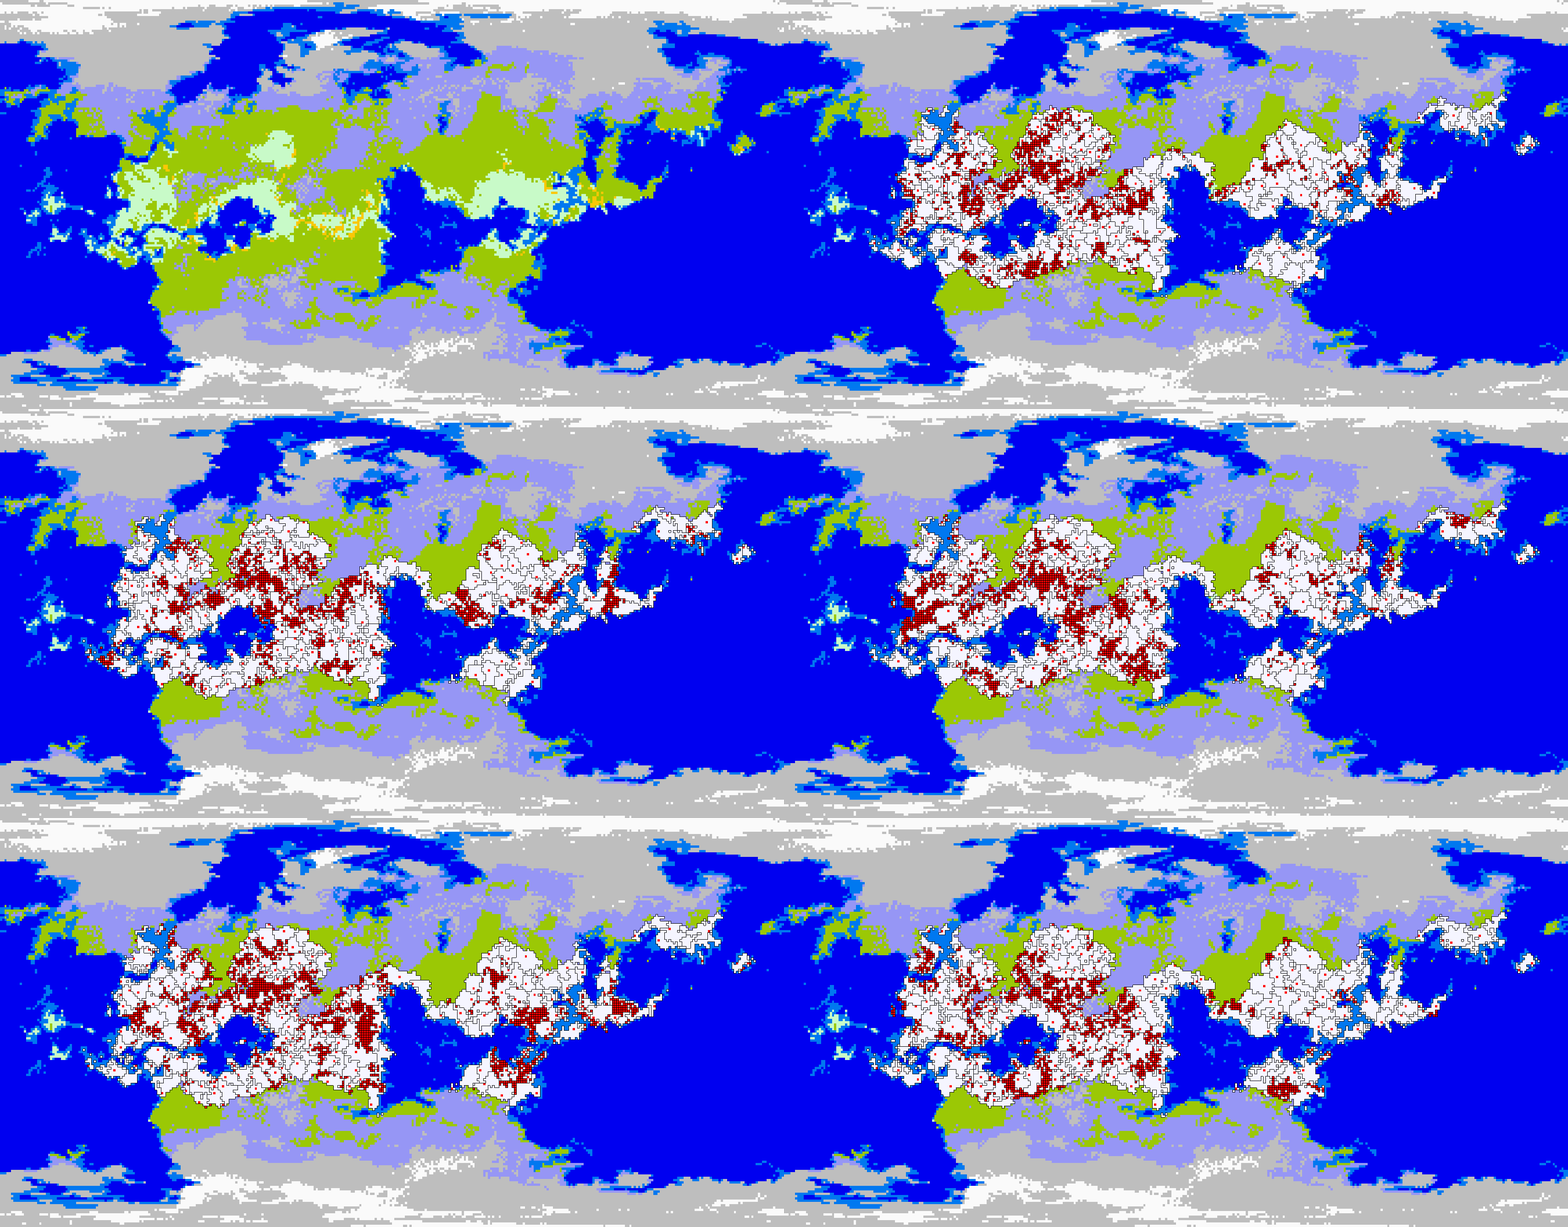
As I was building the sim, I knew I wanted to end up with a model more complex than the original model, so from the very start I built in one change: the introduction of capital tiles. Each polity in my simulation has a capital tile, colored bright red. No matter how large a polity grows, when the capital falls, the entire polity disintegrates.
What does disintegration mean, for this simulation? It means all tiles in the polity become independent. When a tile is independent, it is its own capital, thus it is marked in bright red. Bright red areas, in all versions of the sim so far, mark areas without large-scale state formation. (Often the result of recent state collapse, though areas stubbornly resisting state formation do appear from time to time.)
After some decent amount of trial and error, I managed to get a version of the sim largely similar to the article model up and running. And I quickly realized this would not do:
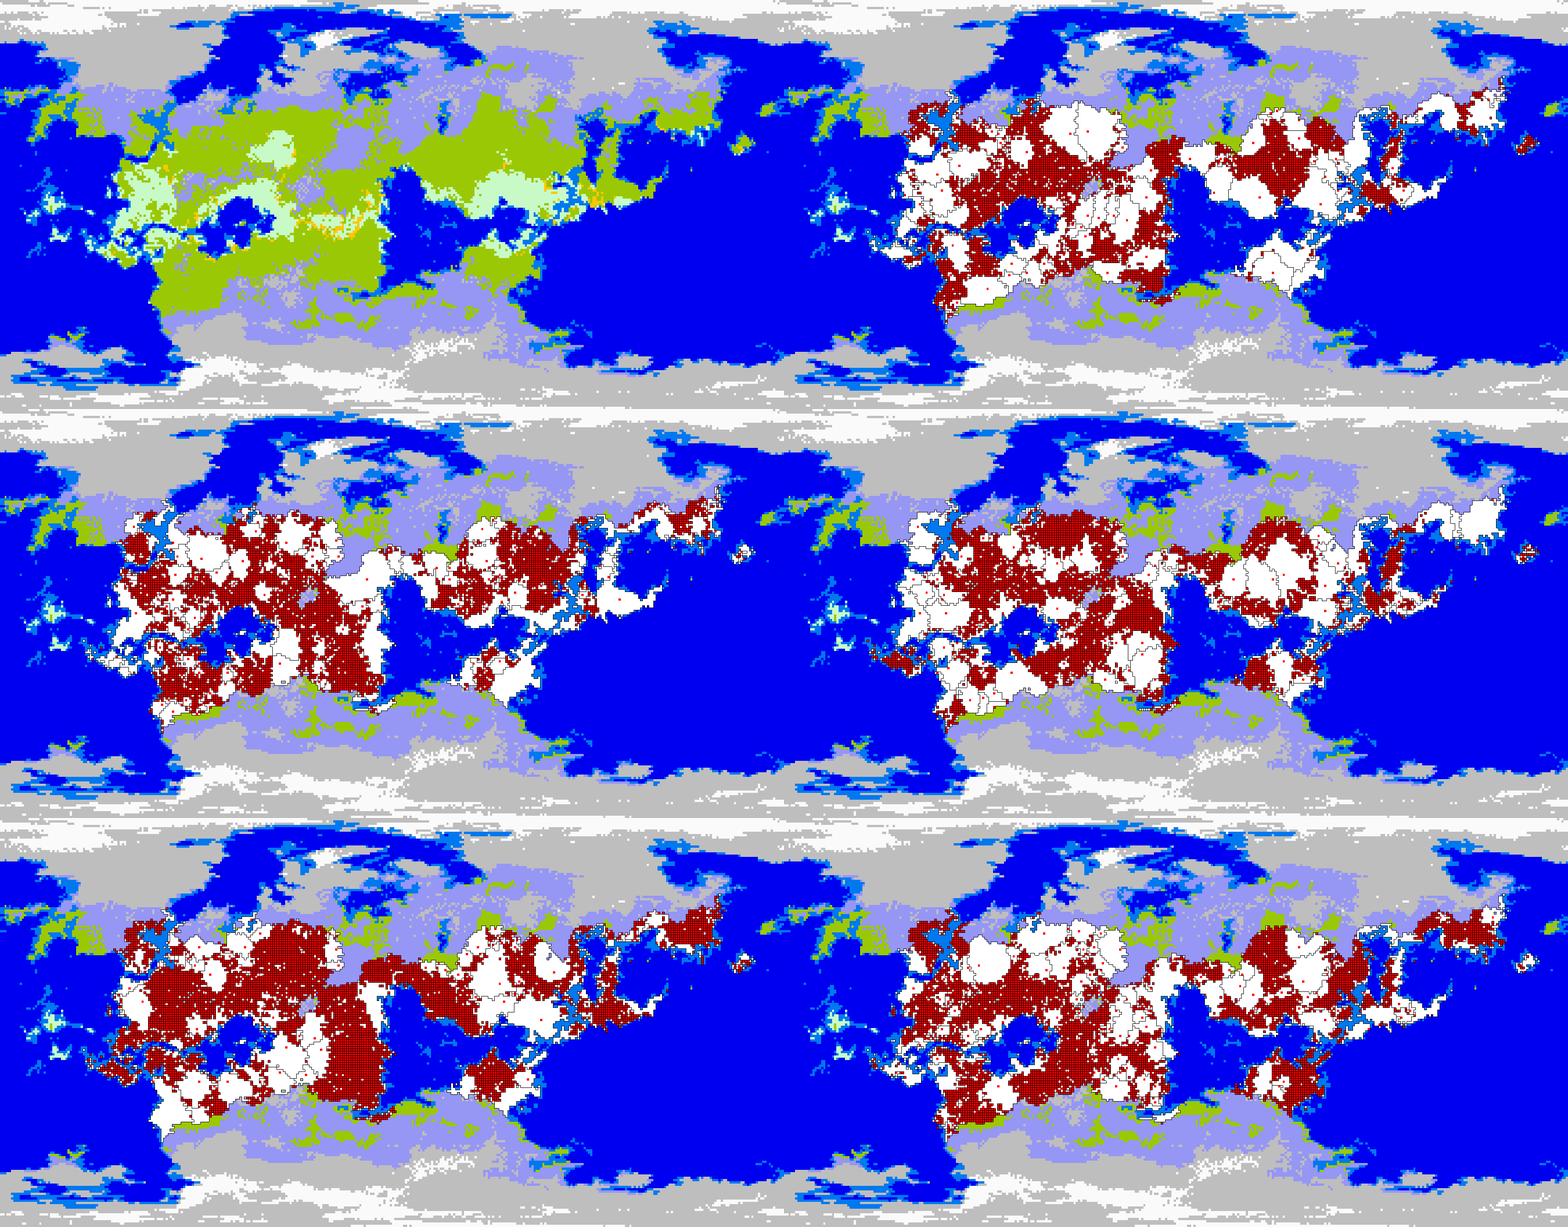
Regrettably, this gif is after I already modified the original behavior in a failed attempt to address the problem, so it needs some explication to make clear what is happening here.
What you're seeing is that in the original model, there is only one constraint that stops polities from growing continually larger: each step in the simulation, polities have a random chance to completely disintegrate. This chance increases as polities grow larger, eventually becoming 100%, i.e. guaranteed disintegration that step.
The result is that the polity life-cycle in the original model is as follows:
A multi-tile polity is born when a single-tile polity successfully conquers a neighboring tile.
With the added strength of the conquered tile increasing its military power, the polity will now continue to conquer and conquer, rolling over all tiles it comes across.
As it keeps conquering, its disintegration chance rapidly approaches 100%, and it 'pops' into its constituent tiles.
From the newly independent tiles, new multi-tile polities are born.
This is the process you see in the gif above: grow-grow-POP-grow-grow-POP.
It creates a continual spread of ultra-sociality, but the behavior of these polity's is utterly un-statelike.
I spent quite a lot of time trying to figure out out what to do to change this and introduce proper statelike behavior. I ended up talking about the article and my own sim with my friend @mathowl, and, being a math owl and thus not only owlsome but much better at math than me, he mentioned something that got my gears turning: in the original article, even though size is part of the functions for attack and defense, it actually does not contribute to military power. Rather, in the original model, military strength is based on the total number of ultra-social traits in all tiles that make up a polity.
This got me thinking, and after much experimentation, (helped a ton by the Desmos graphing calculator), I found a way to get something that began to look like the kind of behavior I desired:
How does this work? In my simulator, military strength now is a function of both total ultra-sociality in the polity and its size, and the function's shape is that of a parabola (an inverted U-shape). As a polity's size increases, this initially increases its military power accordingly. Until it reaches the vertex (peak) of the curve, and then any further increase in the polity's size decreases military power, eventually capped at zero. The total ultra-sociality determines the location of the vertex (at what polity size military power maxes out and how high that maximum is).
I have no qualms about this being a case of creating the function/model to produce a desired result. But I do have my historical rational for it:
What I'm modeling is the idea that as states grow larger, there is a diminishing return to expansion. That not only does it, obviously, require a greater military investment to maintain control over a larger swath of territory, but that this cost steadily increases (and/or the benefits of conquered territory steadily decreases) so that after a certain point maintaining control of newly conquered territory requires a larger investment of military power than the territory provides in increased military power.
The Roman Empire is my historical example guiding my thoughts here. After the end of the Republic, the Roman Empire fought numerous wars and conquered numerous territories. But they rarely lasted, because ultimately maintaining military control over far-flung areas like northern Britain or Mesopotamia was a net loss. In times of crisis, these areas were often abandoned as the Roman military focused on defending actual core territory instead. This is represented in the model in that once a polity has crossed its peak, losing territory actually increases its military power again. I.e. a polity will defend ever fiercer as its outlying territory gets taken away from it.
I spent some time tinkering with this revised model, calibrating the functions and adding some additional features. I'll try and explain this a bit further in the next part, for now I think after all this text, and only a couple of short gifs, you probably just want to see what the actual simulator does. So, I'm just going to skip right ahead to showing you the video that was the final result of my Excel programming (before porting the code to Python):
This post has been further promoted on Facebook, Instagram, Reddit and Twitter by the SteemSTEM team!
Do you play crusader Kings, Europa universalis, Victoria or hearts of Iron?
:)
Yup! Love them! Still waiting for Victoria 3. Maybe next year? ;-)
Great, we grand strategists are a rare breed here:))
Vic3 would be awesome. I am so underwhelmed by Imperium.
!BEER
View or trade
BEERat steem-engine.Hey @jd4e, here is a bit
BEERfor you. Enjoy it!This is amazing. I'm a beginner programmer and I haven't come close to making anything like this yet. It would be interesting to incorporate co-operation style in the weighted military strength of a polity tile and its likelihood of disintegration.
The Journal for Artificial Societies and Social Simulation published this interesting co-operation simulation a few years back.
https://egtheory.wordpress.com/2013/06/30/how-ethnocentrics-rule/
Thanks! I think even as a beginner you'd be surprised how much you can do with an idea and a plan! I'm certain coding-wise I'm not doing anything particularly special, I just started small and kept building. (And learned a lot from a bunch of amazing tutorials/friends.)
Cool post! Never thought about a history simulator, or even one like that!
Thanks! Part of it was the article, part of it was just lots of ideas that've been brewing in the back of my mind for years now that I finally found an outlet for.
This post has been voted on by the SteemSTEM curation team and voting trail. It is elligible for support from @curie and @minnowbooster.
If you appreciate the work we are doing, then consider supporting our witness @stem.witness. Additional witness support to the curie witness would be appreciated as well.
For additional information please join us on the SteemSTEM discord and to get to know the rest of the community!
Please consider using the steemstem.io app and/or including @steemstem in the list of beneficiaries of this post. This could yield a stronger support from SteemSTEM.
Congratulations @jd4e! You have completed the following achievement on the Steem blockchain and have been rewarded with new badge(s) :
You can view your badges on your Steem Board and compare to others on the Steem Ranking
If you no longer want to receive notifications, reply to this comment with the word
STOPTo support your work, I also upvoted your post!
Vote for @Steemitboard as a witness to get one more award and increased upvotes!
No words, the work speaks for itself