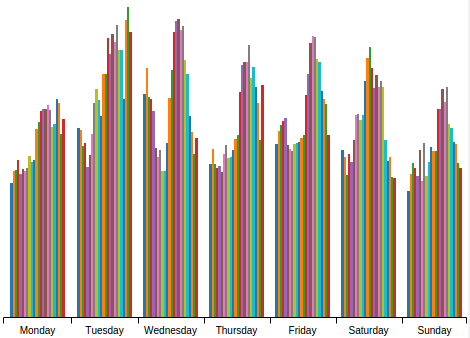
This new page on the steemreports website shows when in the week people (and bots) vote most. It updates automatically to include the average of the last 4 weeks worth of data from the blockchain.

http://www.steemreports.com/vote-days/
Thanks to @guttormf for his suggestion to stack the vote data by day as well as by time which this graph already does: http://www.steemreports.com/vote-times/
Please vote, resteem and follow us for more reports and services, and visit our website:
http://www.steemreports.com
This was so helpful thank you! Upvoted and resteemed
Thanks for the support.
Mmmm interesting. so It looks like to me generally the evening and early night times is the best to vote? or does the time of the graph start at midnight?
The graphs start at midnight, and use UTC times. Click here to see the current UTC time where you are.
Also, the grey bar in this graph shows which UTC hour you're in:
http://www.steemreports.com/vote-times/
Awesome!! thanks for the help :D
I thought the grey bar was a bug. I see that it is included in the infobox though. That should be enough :-)
Yeah, I'd ideally have made it a bit more obvious, but the library I used didn't give me many easy options.
This does include the bots so there are 70% of those .. best to follow trend.
Do you mean you think 70% of accounts are bots?