Technical Analysis in Bitcoin. Elliot Wave, technical patterns and volume profile analysis used.
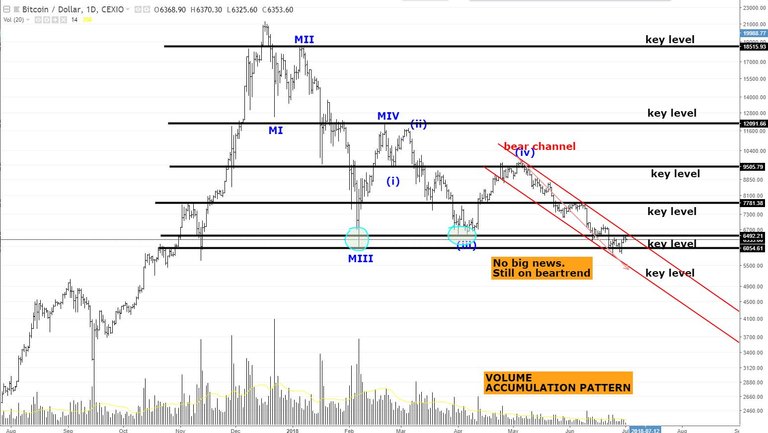
Let's see the bigger picture first:
Bitcoin (BTC/USD) daily chart bar

Key levels and bear trend channel still being respected from prior analysis
Clearly on the upper bounds of the bear channel. After breakout, Bitcoin will have several % to move without major resistances.
Also check out the accumulation pattern in volume.
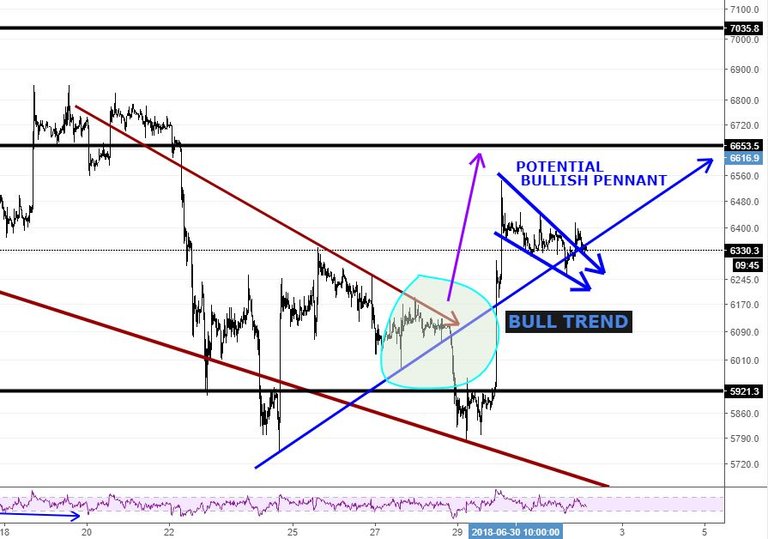
Short term analysis in BTC/USD
Bear target has been reached and now is headed to the bull target of the prior analysis. Price is still bounded.
There is a potential bullish pattern being confirmed. Check out the bull flag. They are continuation patterns of the prior bullish move.

@luiggih if it really happens hopefully may god bless you
Sorry, but I get an error every time I try to upvote. I love the quality of your technical analysis with all the labeling, of volume accumulation pattern, key levels and note on no big news... I keep hoping you get more traction from followers because of the high quality posts.
On your chart I see 2 previous bullish flags which unfortunately failed to work out. Ellitoe count does shows one more leg up to 6.5-.6.6k area. But it can also end at 6.4 and go down again. Let see how btc materialize it self.
Well we could not have asked for more perfect timing for your call. It nailed the $6653 target. Now we need to see if there is enough energy built up for the $7035 next resistance level.
Apparently bitcoin is looking bullish at least in the very short term! Great news my friend!
hey i gave you an upvote dont forget to follow me for future upvotes & i always follow back