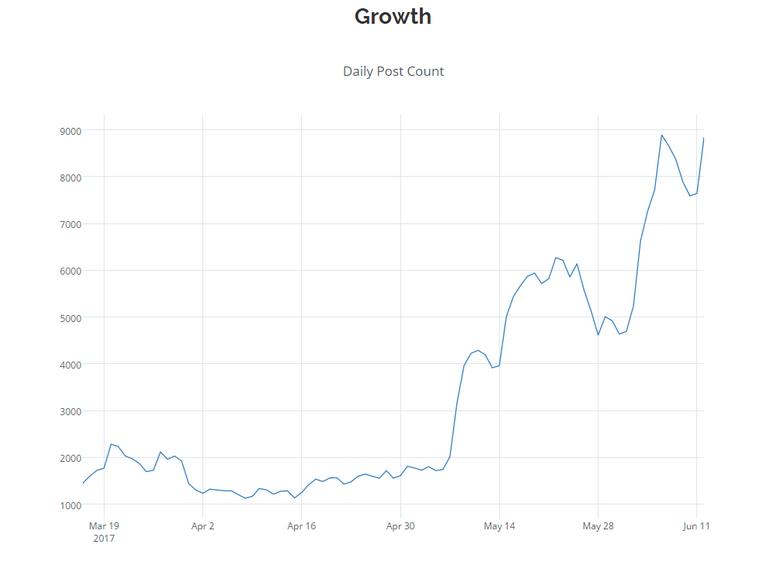
Thanks to @furion's brilliant SteemData resource, I now have access to data an every aspect of all posts published on Steemit. Using a statistical software package, I will be able to slice and dice the data and produce meaningful statistics on payouts, posts trends, new account trends etc.
The above graph can be viewed on SteemData.com but access to the full database will allow graphs to be produced on things like:
- Average payout per post
- Average payout per post thread
- Average word count per post
- Payout - Word count relationship
I am going to release a series of posts showing the highest paid posts in each of the threads - both for May and 2017 to date. I produced this for introduceyourself but I plan to do it for the other key threads such as:
Technology
Art
Photography
Writing
etc.
I look forward to sharing.


This post received a 5% upvote from @randowhale thanks to @bitgeek! For more information, click here!
Statistical analysis is always interesting : )
I'd love a web front-end, so that everyone can play around with it ; )
What package are you using to slice and dice the data?
Also worth having a look at is the STEEMSQL project http://www.steemsql.com/
Hey, I'm using R
Yes!
Great tools
Seems convenient for the users ...
Sounds like very intriguing data, I am looking forward to seeing it - growth really seems to be skyrocketing at the moment. It's exciting to think where steem is going to be in one month, or even one years time.
Should be interesting checking out each month, would be funny to scale down to the top 3/5 threads per month.
Keep it coming bitgeek.
For someone new to the platform this would be amazing!
That's great! Can't wait to see the results :-)
I'm happy to see this data becoming more and more accessible. Looking forward to some of your analysis and insights!
Nice site. Definitely will be using this.
sounds interesting.. can you share how did you get the base data? what analytics tool are you using?