Technical analysis on multiple timeframes
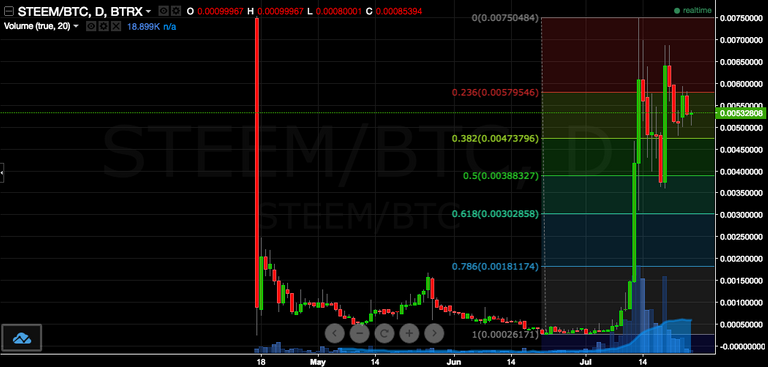
- 1day time frame: after the massive run up started on the 9th of July which led to a relative high of 0.0075 on the 13th, the price has been taking some time to reflect; at the moment the 50% fibonacci retrace at 0.00388327 showed decent support on the 18th and the 19th; price is coiling in the middle of its range (0.0075/0.0038); only a breakout of its range high could generate buying interest and lead price higher.

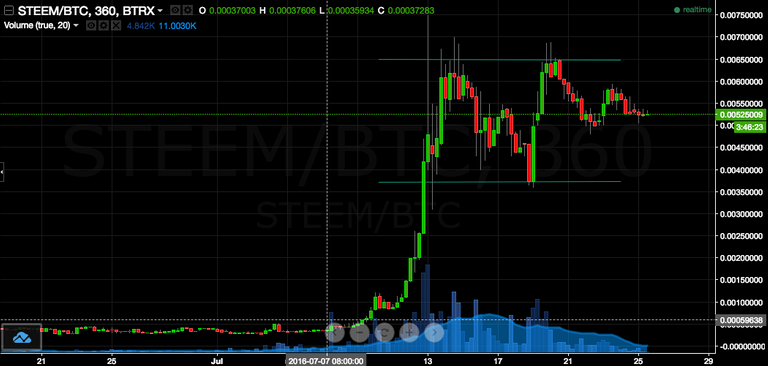
- 6hrs time frame: on a quicker time frame price is consolidating between 0.0035 and 0.0065; the recent up-move would suggest for price to go higher after this pause if support holds

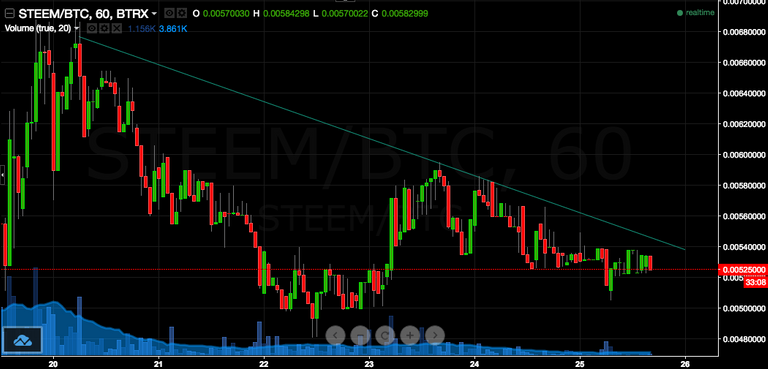
- 1hrs time frame: monitoring if price is able to break with decent volumes its descending trendline

Disclaimer: The information contained herein is not guaranteed, does not purport to be comprehensive and is strictly for information purposes only. It should not be regarded as investment/trading advice. All the information is believed to come from reliable sources and the author does not warrant the accuracy, correctness, or completeness of information in its analysis and therefore will not be liable for any loss incurred.
very nice and tidy charts! keep it up!:)
@steemed @kushed
technical analysis done professionally, check my blog and feel free to judge its content