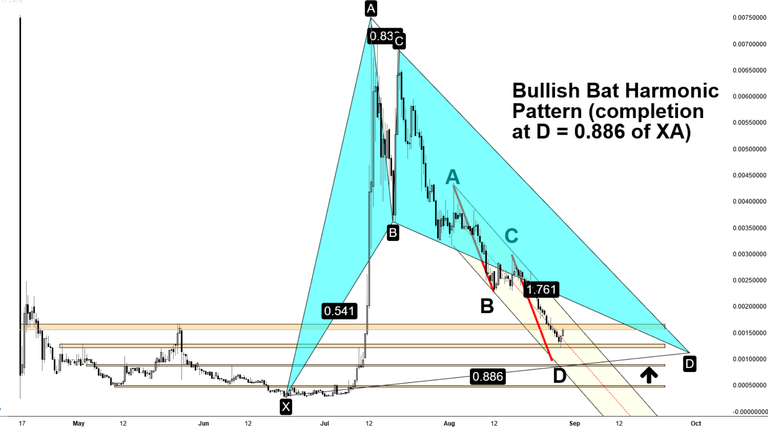
Steem 12-Hour Arithmetic Chart:
If the current horizontal support zone fails (second orange box down), the next support zone (third down, marked with a large black arrow) looks interesting as a potential reversal zone (PRZ) - a spot that might mark a turn into a new bullish uptrend.
Lots of Confluence
If you look at the above chart you'll see an AB=CD harmonic pattern that completes its CD leg just above that horizontal support zone, as well as a bullish bat harmonic pattern that completes its CD leg. Both of these harmonic patterns are counter-trend trading patterns - they are high probability "turning points", or pivot points, in price.
The fact that they both complete within such a narrow price range, added to the fact that the next horizontal price support zone is so close by, makes the case for a lot of demand coming in around that price zone. That could be the spot where a new uptrend starts, or, at the very least, a huge upward correction is Steem's price occurs.
