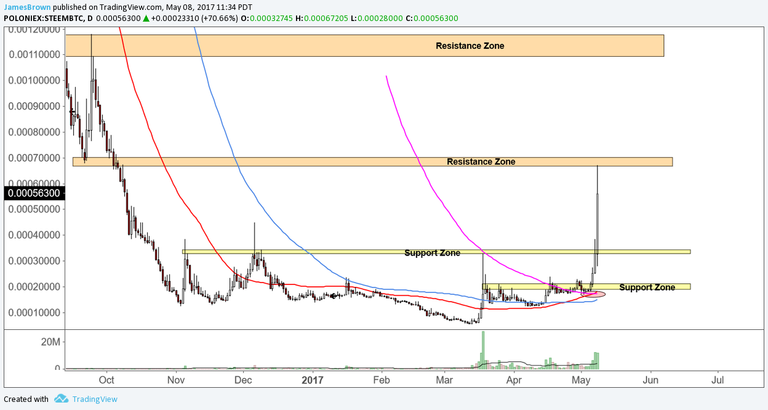
Well, the price absolutely blew through the resistance zone that I expected to hold down the price, so it's now a SUPPORT zone.
I don't know what Steem will do by Friday, but I would expect that price comes back to test the recent resistance zone breakout area (second yellow rectangle from the bottom on my chart below) before taking out the resistance zones (shown in orange). Bear in mind that I was wrong on my prediction before, on this very post.
All I can say is that odds favor a test of breakout areas before continuation of uptrend, but it doesn't always happen. The fact that Steem busted through the last resistance zone so quickly indicates to me that this is an abnormally strong move, especially given that the 200 simple moving average is still so steeply declining, as it's usually a dependable indicator of selling/ buying momentum.
Bigger Image: https://www.tradingview.com/x/LOrYiwzw/
