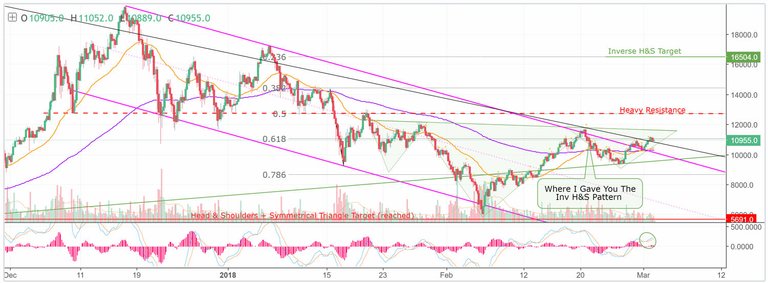
Hi friends! Welcome to this update analysis on Bitcoin! Let's get right to it! Looking at the four hour BTC -0.50% chart, you can see that Bitcoin -0.50% has found resistance at the 61.8% retrace, and is now back-testing the black trendline as new support. This is actually very constructive price action. If you recall from my previous post, I said "Just above is the 61.8% retrace, so BTC -0.50% may just grind higher, as it runs into overhead resistance levels." So far, BTC -0.50% appears to respecting those levels, as it stair-steps higher.

For the purpose of educational demonstration, I'd like to point out how reactionary my trendlines have been. There has been a lot of speculation as to the accuracy of my trendlines , but you can see that they have been, and continue to be perfectly reactionary. Looking at the green trendline , you can see that it was supportive on 2/2, and then it was resistive on 2/8-2/12, and then supportive again on 2/25. Many people wondered why I used the low of 9/22 to form this trendline . The reason, is that the line produced from that low was intersecting with the recent price action, in a reactionary way. Sure, the low of 9/15/17 was more significant, but connecting that low to the low of 11/12/17, produces a trendline that shoots way above the price action. In other words, it's currently irrelevant. That is a perfect example of how and why I utilized such an obscure trendline . So when you're drawing trendlines on your chart, look for areas that have been reactionary in the past, and try to catch those areas with your lines. The likelihood, is that previous levels of repetitive support or resistance, will continue to be supportive or resistive in the future. With that said, I typically try to avoid cutting through price action, unless there is added technical significance. The top of the pink downtrend channel is another example, where I knew to cut through the price action of the peak on 2/20. The original channel was formed from the all time high and the high on 1/6. The break above it, on 2/20, was a failed breakout. A lot of people were trying to catch that peak in the drawings of their channels, but it was actually a breakout, that reversed back into the channel. You can see evidence of this in the most recent price action, as BTC -0.50% broke above my channel, and tested it repeatedly, from 2/27-2/28. If my channel was wrong, BTC -0.50% wouldn't have been back-testing that area.
Overall, the right shoulder continues to fill, as BTC -0.50% moves closer to completing the pattern. I did see some people saying that there was a "confirmation" of the inverse head and shoulders pattern, and this is technically not true. The confirmation will be on the breakout above the neckline, which is the green trendlineconnecting the peaks of 1/28 and 2/20. The volume is light, but that is typical for price action into the end of a right shoulder. The MACD is expanding over a weakbullish cross, and it has a constructive look for stair-step price action.
From here, let's look to see if BTC -0.50% finds support on the black trendline , and then breaks above the 61.8% retrace. Once that move is completed, the next level of resistance is the neckline. A break above that should catapult us into the heavy resistance, at the 50% retrace, around 12,750. A this point, a breakdown back into the downtrend channel would be a bearish development. I'm the master of the charts, the professor, the legend, the king, and I go by the name of Magic. Aurevoir.
This has been your not-so-humble market wizard, droppin' knowledge like bombs in this place! Please follow, comment, like, and share on social media. Good luck trading everyone!
***This information is not a recommendation to buy or sell. It is to be used for educational purposes only.***
-MPC loves you-
-JD-
Try and use the language we can understand for not all of are schooled on the working principles of coin world. Thanks