Hello all,
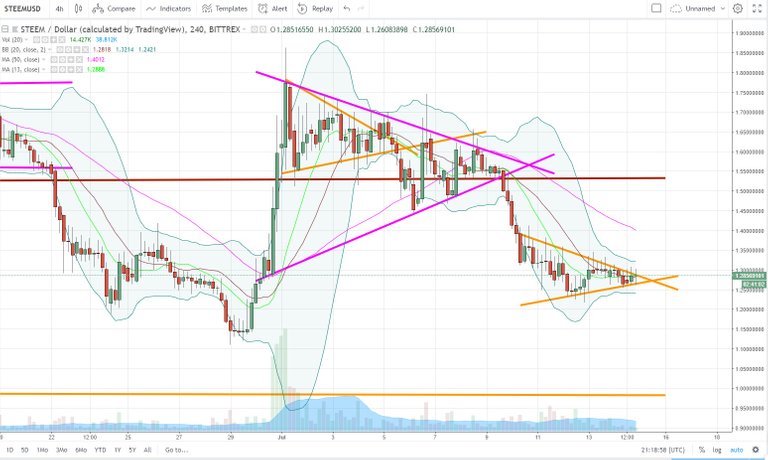
Here is the chart of yesterday :

Here is the current chart :

So we broke the triangle by the upper side. This break doesn't look very powerfull so I'm expecting a second move soon and we have no warranty that we will stay upper. We need a clear break out with a nice volume to confirm the break of that triangle. If this is not the case, the break is not confirmed and we have perhaps to extend the triangle. Let's see what will happen in the next hours.
I wish you massive profits,
Cryptopassion.io
Disclaimer : Never invest more than what you can afford to lose. This post is my personal opinion, do your own research before making any investment decisions. If you make any trades after reading this post, it is completely in your responsibility. I am not responsible for any of your losses. By reading this post you acknowledge and accept that.

Do you want them spendable directly via a dedicate plastic Visa card ?
Do you want receive back 0.5% of your spending in Bitcoin ?
I recommend you the platform


Fingers crossed
I’m beginning to think all these charts are good for is showing history rather than the future although some would say the further you look back at history the further you can see into the future . Cheers mike
Well, technical analysis is great for describing why past events happened ;)
Hi - This post has been upvoted by an in-development voting bot, which was created for a university project-work!
Please also leave a upvote for me, so that my votes will mean more in the future!
Come on Steem! I’ll kiss it if you break out.
As you have expressed it, it is a crypto passion, the question of cryptocurrencies is the future ..
I said in your previous post that the break would be to the up side because it reached a relatively strong support line
However, the break is weak, it must wait to retest the support line.
A slight bit of good news. Let's see if this has legs.
After reading some comments here I though I'd share my 2 OMGs. Regarding TA, I've been trading like that since I was 18, 33 now. It's not whether it works or doesn't work, but rather gives you a true reflection of what the market is thinking. Every pattern tells a story, and knowing how the market feels is crucial in this game. The same way a candle can show you price rejection and a series of candles converging on a specific point shows you either support or resistance. This triangle and volume tells us that buyers aren't buying and sellers aren't selling, they are waiting (narrow range). A breakout in either direction is a sure thing. I think up because of the faith in this tech, but as always could be down too. I would encourage everyone to learn as much as possible about TA and price action for better decisions.
I agree triangle pattern means breakdown on the upper side or lower side
wow great concept sir..
@cryptopassion
Supperb article brother...
Your article is very usefull for everybudy
Every up-movement on Steem is gold for now!
I take it :D
Very useful article bro.
nice article