It's been a long time since my last price analysis post, but now is a good time to check back in on the recent STEEM price movements.
A lot has happened since February. Volume is up significantly across the crypto markets and STEEM has not been left behind. The last two months have seen a lot of action and the last two days have given us a thrilling ride. Let's see where STEEM currently stands and where it might go.
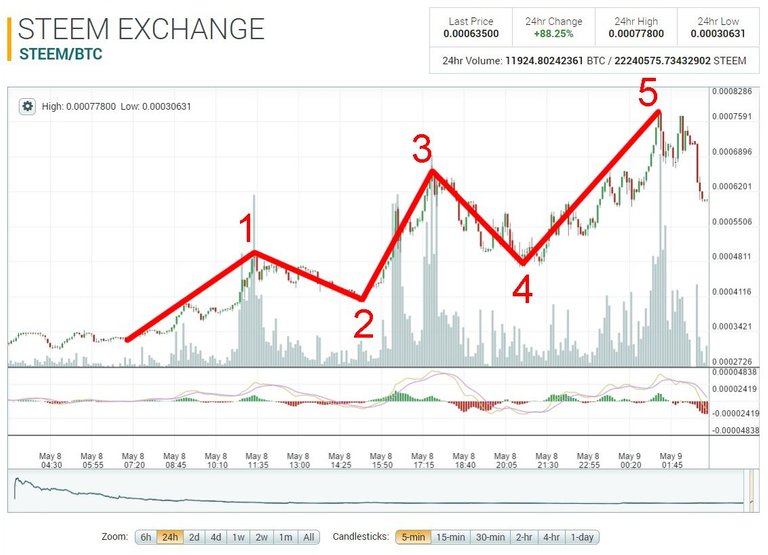
On the 24-hour STEEM-Bitcoin chart from Poloniex, we have what appears to be a completed Elliott wave (dominant trend), culminating in a double top around 77K Satoshis. Notice the large volume spikes on each of the up-waves, followed by a sharp drop in volume during a corrective wave. Also notice how large the 24-hour increase was: from a low of under 31K Satoshis to a high of nearly 78K Satoshis.
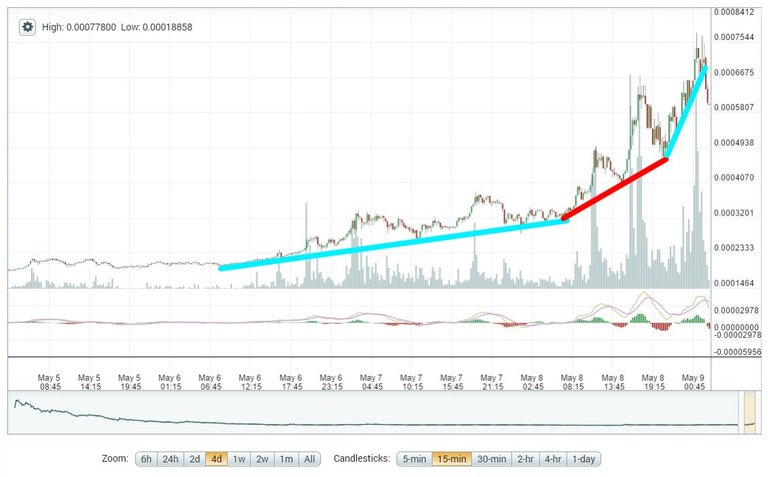
We can see how quickly the price has jumped when looking at the 4-day chart. Notice the increasing momentum of each leg up. The third line demonstrates when prices start to go "hyperbolic." This is usually unsustainable for any prolonged period and a correction is almost guaranteed to follow almost as quickly as the price rose. In the span of less than 4 days, we can see that the STEEM-BTC price rose from less than 17K Satoshis to nearly 78K. It's certainly a fun ride, but it can't go on forever without a break.
Here's a recent look at the Poloniex depth chart. It actually appears pretty good to me, considering how it looked several months ago with heavy bias on the sell side nearly every day.

So, now that the prices have spiked, what can we expect next?
Looking at the long-term trends, we can look at two different levels for a deep correction if prices can't be sustained at current levels. The first stop would likely be in the 48K Satoshi range. There is a long-term support/resistance line at that price going back to October, plus a recent support/resistance line during the recent move.
If 48K Satoshis cannot catch the correction, then we could see prices fall back to around 32K, where this most recent uptrend began a couple of days ago. I would not expect a nearly full retracement, but it is not outside the realm of possibilities for volatile cryptocurrencies. However, if such a correction should occur, there is more support at those prices in both the long-term and short-term.
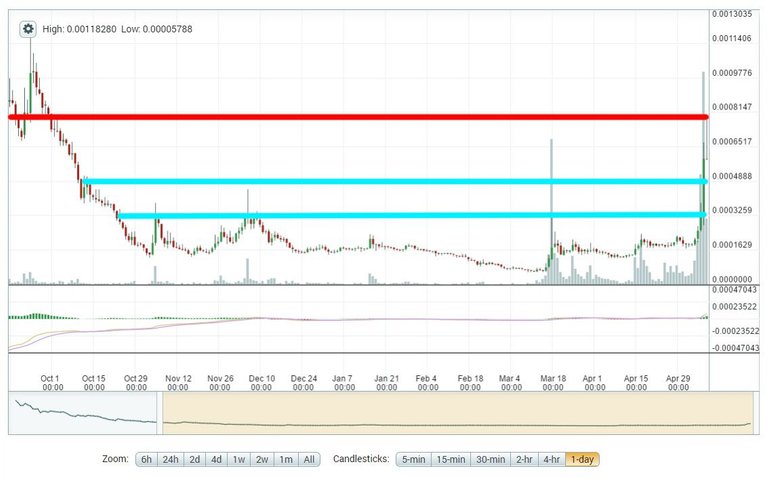
The STEEM-BTC price has broken through a few wedges over the last 48 hours or so. It appears to have made a double top after a five-wave uptrend, but we won't know for sure until a little more time has played out.
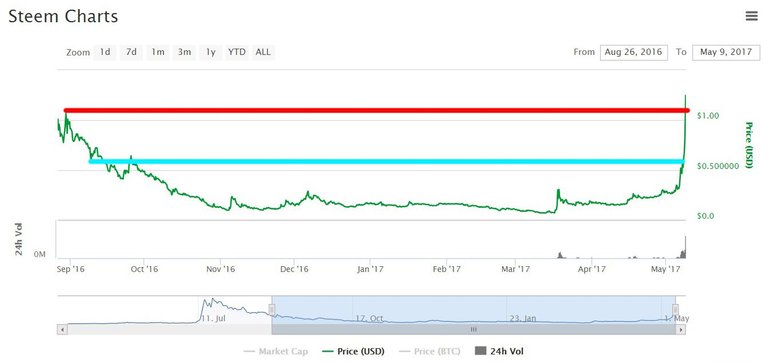
Looking at the STEEM-Dollar chart, we can see that it has broken through to new highs that have not been seen since last August. It's currently over $1.10 as of this posting. It broke the $1 mark a couple of times on Monday, and even fell back down to around $0.80 at one point before recovering again. If the price makes a deeper correction, we could see it fall back to around $0.60 before catching some minimal long-term support.
The recent price increases have given some users a little more incentive to power down some of their holdings, so we have an increase in expected power downs starting next Friday, with a sharp rise on Sunday, according to Steemdb.com. This should be expected and really isn't a cause for concern at the moment. The markets appear to be absorbing plenty of sell orders, even before the recent upswing. Most of the volume being moved on the exchanges is most likely traders, so the powered-down volume is a drop in the bucket.
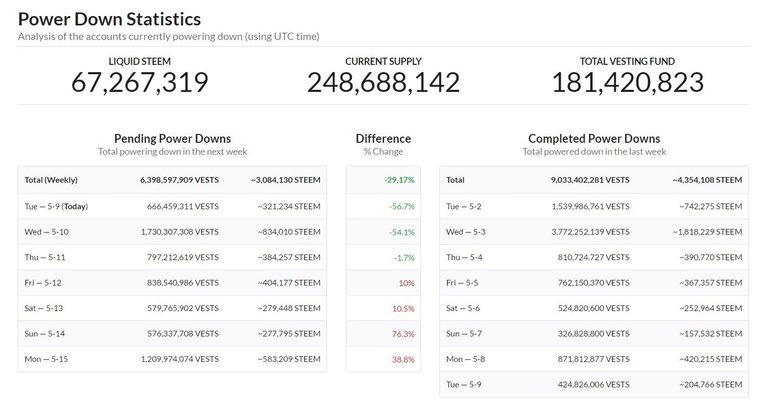
Overall, these are pretty exciting times for STEEM and the users of the Steem platform. Many of us have waited a long time for prices to recover from last summer's highs, so this is a welcomed change, even if it is short-lived. I am of the opinion that it's not and that we may see even higher prices by the end of the month. If you're investing or trading, make sure you're not risking more than you're willing to lose. Be careful when chasing price spikes. Watch for the technical indicators - crypto markets often follow them rather predictably....and often, they do not.
Consult a professional if you need help. I am not a professional.
If you have any critiques or comments about my non-professional analysis, please let me know. If you're excited to trade this market, good luck to you!
Disclaimer: I am not a professional advisor and this info should not be used for trading. I would be flattered that you think so highly of my fairly basic analysis, but it would not be prudent to use this for transacting with real money.
*Charts are from Poloniex and Coinmarketcap.com. Analysis is current as of approximately 11:30pm EST, May 8, 2017.

I always enjoy seeing some TA! Especially when Elliot Wave is involved! When are you a buyer of Steem then? Once it retraces to 48k satoshi?
Resteemed!!
I think 48K is a good level to make a buy. I wouldn't go all in there, however. But I'm a little more conservative than others. If you get in there, I'd put in a tight stop-loss.
Completely agree with you @ats-david
I really enjoyed your post, it is a wonderful time for steemers and anyone involved with crypto's for sure... Personally I think the best method is just to dollar cost average into the tokens that you believe in and not touch them at all for the next 5 to 10 years... less your really good at trading and have some great skills... I include myself in this... I scalp the stock markets everyday but I'm way more profitable when I just hold something and don't touch it no matter what the short term price does... for me its taken years to become even decent at day-trading...
oh and I believe your 4th wave is breaking a rule...
Yeah, that 4th wave did in fact dip below. It's just one of those things. It may prove to not be a true dominant trend. We'll find out if the price breaks into new highs soon.
for sure... time will tell, I'm really bullish on it myself even if it was to drop quite a bit in the short term.
Thank you arts-david, it was very informative and it will be exciting to see what will happen in the next few days. Lets hope it stays positive.
"Disclaimer: I am not a professional advisor and this info should not be used for trading. I would be flattered that you think so highly of my fairly basic analysis, but it would not be prudent to use this for transacting with real money."
But it's MAGIC internet MONEY
:p
That's true. Buy that magic interwebz munny and trade away with this very professional advice! It's the bee's knees!
Good comeback @ats-david
Nice analysis. Very much appreciated :-)
Thank for the info and taking the time to lay it out.
Very nice post!! Helpfull!
Thanks for posting this analysis!
Great analysis! subbed
Great TA
@ats-david Thanks for sharing
agree with you
followed
I really appreciate all the good info. Would be great if we could see a slow steady rise, rather than these big spikes. But it is encouraging to see the increase, and intersted to see where the new support level will be.
It will be interesting to see where the price goes by the end of 2017 @ats-david. I'll keep watching.
thanks for god jobb
How high did it actually go in USD?
I think it peaked around $1.32 or so.
Great post, thanks
apprec the analysis thank you for sharing
I would be interested in some very basic tutorials for TA for people who have no clue about it (like me).
I'll see what I can do. Maybe I'll grab someone for a few collaboration posts.
Cool please send me the links if you do it:)
nice charts and I believe your spot on!!
A selloff is the only way to start a bull run. It's up from here.