Summary
- With hundreds of Steem-Engine tokens and dozens of the most popular ones, it is difficult to say in which direction this market is moving.
- A solution can be a price index showing the average movement of the most traded tokens.
- I made an index named SETX, it contains the 25 most traded tokens daily.
- The index moves close to the USD/STEEM price, underperformed it only slightly in the last 33 days.
If you find this post too long, read the summary and jump to the charts. Today, I’d like to introduce to you a new index. I have analyzed many stock-market and bond-market indices before, also how they are calculated. I think I can make one myself. Because in the jungle of hundreds of new Steem-Engine tokens, it is difficult to say where the market is heading on.
Solution for a century-old problem
On stock exchanges and other markets, experts recognized similar problems more than a century ago. They usually create indices to measure the overall market direction, the short and long term sentiment of investors. The indices can be different, price return or total return ones, weighted or equally weighted, etc. But I think a simple price index should be enough in our case.
This means a simple average price change. For example, I wrote here on Thursday, analyzing 25 tokens:
In a month, from 7. July to 8. August, Steem fell 44 percent in USD terms. Popular SE-tokens like PAL, LEO, NEOXAG or CCC fell 69, 67, 77 and 71 percent, respectively. The average fall of the 25 tokens in this research was 51 percent in a month.
But which tokens?
So, explaining it with common sense: This average price change is what I want to calculate regularly and according to clear rules. The average price move of the most important, most traded, popular, most sold or sought ones.
The question is: which are this tokens? And the problem is: What can we do with the constant changes of popularity, the group of tokens issued, sudden trading volume and price jumps, insane very high volatility? Volatility and other changes seem to be the only one, the unique sure thing in this market.
Dynamically changing basket
I decided to make a so dynamic index I don’t think exists in other markets. An index with a dynamic, constantly changing composition, “basket”. I save every day the list of tokens with the highest trading volume on the page “Market” of Steem-Engine.com. I calculate their price changes from the previous day, and I calculate the average of it. With this average change, I modify the daily value of the index. (July 7, 2019=100.)

(So, this index is not weighted. Tokens with more capitalization or trading volume are no more important than others. I think market capitalization data is not always reliable, and daily volumes are too different. Between 80 and 20 000 USD, for example.)
The best 25?
Originally I thought 10 index members should be enough, but I realized that there can be also 20-30 “relatively liquid” tokens a day – with a volume over 100 USD, for example. There is not so much difference in the volume between the 10th and the 20th token, for example. So I decided to make a basket of 25 tokens daily. If the market evolves and many tokens will have a relatively high volume, we can easily increase this number.
Turned out to be a bigger problem that some tokens – I suppose mostly the new ones – showed a crazy, unreal price movement, sometimes. Like the one which jumped 2100 percent in a single day. That seems to be not only extreme, I consider it impossible in a real market environment.
Capped spikes
Such a price is not a market price, in my opinion. (Maybe the previous, initial, first-day price was nonsense, artificially set, for example.) So I made a cap: if the price of any token changes more than 50 percent a day, I exclude the token from the index. (The token is neutral in the index that day.) That helps to filter out index changes due to the total lack of liquidity or eventual manipulation.
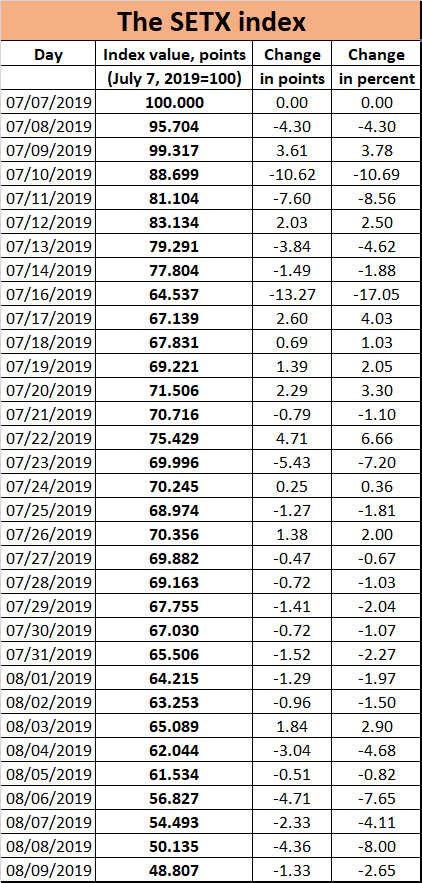
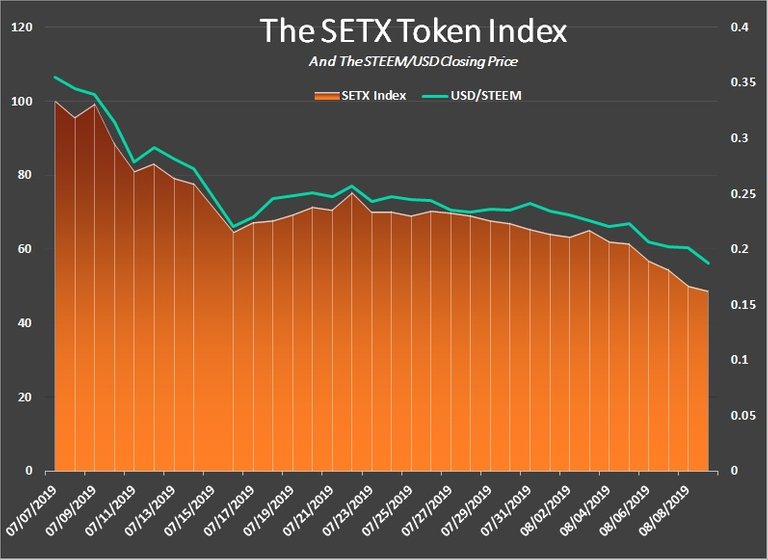
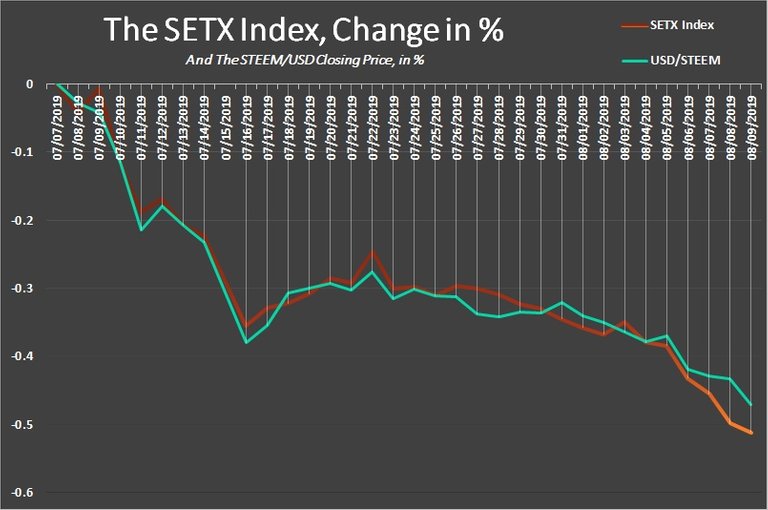
And that’s it all. Not a complicated method. But what shows us this index now? Surprise! It is very, very similar to the STEEM price in USD. Also if we draw the chart in percentage terms. (See below.) The index fell 51 percent since 7th July 2019, and the STEEM/USD, 47 percent. They are closely moving together.

(Click to view in higher resolution.)
Has this index some sophisticated, deep economic, financial, scientific meaning? I don’t think so. Its purpose is to indicate if people are mostly selling, dumping Steem-Engine tokens, or buying them, snapping them up. If buyers or sellers have the overhand. If they are frightened or greedy.
The price fall seems to be very connected to the STEEM price, the small underperformance can be a good sign. Even though many people are dumping their free airdrop-tokens, or trying to make some dollars to live. (Read this interesting post of @taskmaster4450 about the reasons.)
Funny index names
- How simple it would be: Steem-Engine Index – SEX. Do you need explication? This abbreviation seems to be occupied or compromised...
- Simple Steem-Engine Token Price Index – SSETPX? Too complicated to be simple.
- Steem-Engine Token Index – SETI. This abbreviation seems to be taken... (That was the NASA program “Search for Extraterrestrial Intelligence”.)
- Steem-Engine Token Index – SETX. This seems to be fine. Although, this one is also used, for “South-East Europe EUR index”. But South-European shares and Steem-Engine tokens are very far away from each other, so, let’s use this name.

(Click to view in higher resolution.)
I suppose this index will be temporary anyway. Later, with more precise price data sources and more equilibrated token trading, a volume or capitalization-weighted, real-time or near-real-time index should be created.
Please, comment!
If you want to message me in private you can find me in various popular Discord channels (Palnet, Steemleo, Steempeak, Neoxian, etc.)
Series Steem-Engine tokens reports
6. Losses, Losses, And More Losses
5. How To Be Rich, Quickly!
4. A Costly Hobby For Rich People?
3. Which Was The Most Traded Coin?
2. Which Token Fell 80 Percent In A Single Day?
1. Do You Still Believe In Your Tokens?
About the data:
I’m collecting all token prices from July the 7th on, once a day, approximately at 4-5 p. m. UTC (Coordinated Universal Time). I’m not a robot or developer and I’m not always online, so some delays can happen. The data is so more estimation than an exact recording. Data on July 9 and 15 are completely missing. If somebody knows how to regain this information more precisely from the blockchain please message me.)
(Cover photo: Own work)
I am down with an index fund that would be amazing :D
Posted using Partiko Android
Wow I wish there is margin trading on steem-engine market, any trader short would have made massive income
Posted using Partiko Android
Yes, but it is very difficult to organize. Imagine the payment of margin calls.
That will be rekting to who every is paying ☺
Posted using Partiko Android
excellent idea!
Congratulations @deathcross! You have completed the following achievement on the Steem blockchain and have been rewarded with new badge(s) :
You can view your badges on your Steem Board and compare to others on the Steem Ranking
If you no longer want to receive notifications, reply to this comment with the word
STOPAn index is a great idea!
I don't see a problem with SEX.
Teslas cars also spell S3X. Soon even S3XY. If we believe Elons Twitter it might even be S3XYR.
Steem Engine Index? SEX! Yes, please.
Posted using Partiko Android
I don't have problem with sex either, but we must respect others, for example religious people. Let DPORN make its erotic index. Besides, SEX token does exist on the token list.
:(
Posted using Partiko Android
Talking about SEX, you inspired me:
https://steemit.com/funny/@deathcross/how-to-have-more-sex-tokenized-version