In this post I present a tool for online transaction monitoring in STEEM blockchain from last block and calculate average STEEM & SBD currencies flows intensity and ratio. I will use average intensity of STEEM, SBD per minute and flow direction ratio metrics in order to describe STEEM ecosystem state evolving.
On my previous post I've tried to retrieve STEEM supply data from steemd.com web page to proof the STEEM supply intensity declaration in the 'Steem WhitePaper' with 800 STEEM/minute. Now I omit the new STEEM & SBD supply and will investigate transactions inside the STEEM blockchain. It seems the STEEM supply is out of blockchain.
It is interesting to have a whole picture of STEEM moving between liquid STEEM, SBD, and SP to or from exchanges. How these flows are intensive from week to week? Such research will help to build a model of flows inside the STEEM ecosystem. The model is necessary for understanding the real situation with the ecosystem, will allow to find some conformity and predict future possible states. It will be possible to construct and solve a system of differential equations for fluid flow based model in further work.
There are several weekly reports:
- "Exchange Transfer Report" published by @lukestokes and
- "Steemit Statistics" by @hisnameisolllie.
These excellent surveys handle absolute amounts of tokens supplied/transferred and estimate a relative difference values from week to week.
My python script is using the python-steem library written by @xeroc and I am following @furion guide. My source code steem_flow.py is available on github. The python script start to collect online statistics from the last irreversible block and output calculated parameters to a HTML file with 3 sec refresh.
Output example:
block_interval: 3
 from_last_block: 5300787 timestamp: 2016-09-26T07:39:24

 current_block: 5597757 (#296970) time_stamp: 2016-10-06T15:19:33 (10 days, 7:40:09, 14860.1 minutes passed)

 pow2_count: 14347 (avg: 20.7 blocks), each 0:01:02.146024

 transfers: 11436
 to_exchange: 2195 (950443.0 STEEM @ 64.0 spm, 205044.0 SBD @ 13.8 $pm)
 from_exchange: 681 (501884.6 STEEM @ 33.8 spm, 279145.7 SBD @ 18.8 $pm)
 to/from exchange ratio: 1.89:1 STEEM, 0.73:1 SBD
 between_users: 6979
 between_exchanges: 486
 to_null: 1095 (3269.9 SBD) @ 0.2 $pm

 vesting: 3214 (526521.3 STEEM) @ 35.4 spm
 new withdraw: 613 (11369.6 MV) @

 convert: 475 (147044.6 SBD) @ 9.9 $pm
 feed base: 3174 (0.364 SBD), each 0:04:40.874291
Legend of average flow intensity:
- spm - STEEM per minute
- $pm - SBD per minute
We could see that block generation interval is set to 3 sec and more than 10 days are passed from last script running. The pow2 was generated every 20 blocks or each 1 minute.
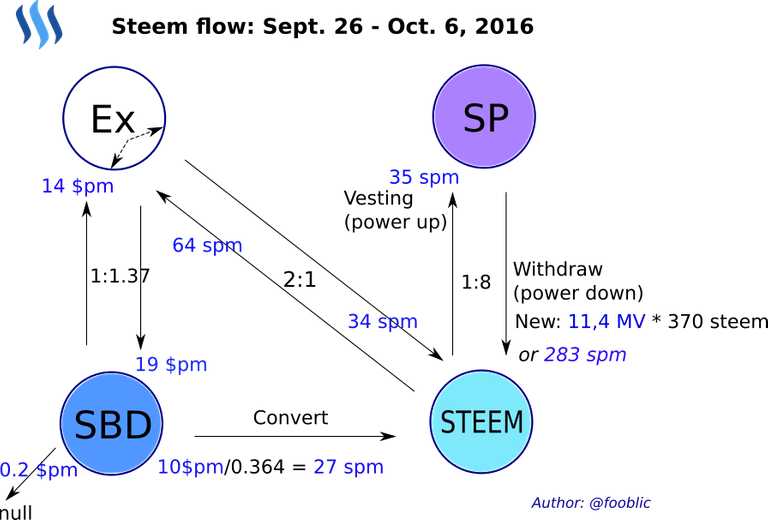
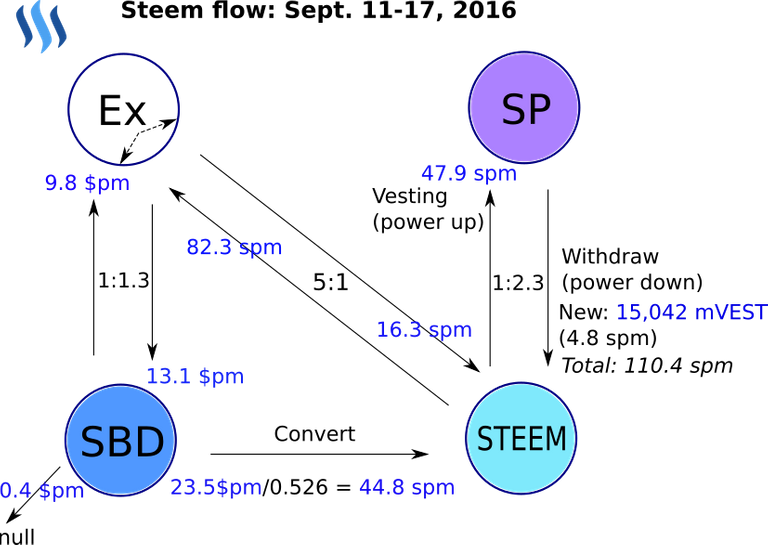
There was more then 11K transactions (0.77 per minutes) at this lapse of time, but most interesting is to compare flows to & from exchanges. The STEEM flow average intensity to exchanges is almost 2 times exceeded the flow from exchanges. A week ago I saw the ratio was even 5:1. The SBD flow is opposite slightly more intensive from exchanges rather to exchanges. STEEM & SBD are not disappearing on the exchanges, its just change their owners. The surplus of the STEEM on exchange creates a pressure to ex-rates and that is why STEEM price go down.
The SBD rate is probably attractive on external exchanges to change STEEM to SBD (currently on poloniex exchange: 1 STEEM -> 66 mBTC -> 0.44 SBD). The internal SBD conversion flow intensity in blockchain is quite less, but SBD selling over blockchain conversion is profitable (feed price is currently about 0.36 SBD). So, STEEM escapes to external exchanges and this circulation gives profit to traders, but drops the STEEM price on external exchanges.
Some amount of liquid STEEM is vesting to SP. In opposite direction the withdraw payouts is divided to 104 weeks. I could estimate new power down rate average value by counting current blockchain withdraw transactions: 11370 MV * 370 STEEM / 14860 minutes = 283 spm. (The next week top-200 planned withdrawing amount estimation from steemdown.com is: 473,745$/0.4/7/24/60 = 117.5 spm). So, the intensive withdrawals will lead to increasing of liquid STEEM amount and finally drop STEEM ex-rate.
The promotion SBD flow rate (transactions to null) is not significant and nothing could add to STEEM economics.
Graphical representation of STEEM blockchain flows:


Further I plan to tune up the script to be more accurate, take into consideration other processes and increase functionality:
- to write intermediate data to Redis DB and return summary in HTML format by GET http-request (python twisted framework);
- to restart the script hourly and write daily/weekly/monthly statistics to graphical file (python matplotlib).
Any comments are welcome!
This is the type of analysis I was hoping to find! I don't the technical skill to work pull the raw data myself, but really appreciate being able to see these inflows /outflows.
As you stated, it really can help one understand the ecosystem. I'm following.
Thank you for comment! I'm happy that you find it useful.
Great work. Repo starred and watched on GitHub.
For those of you who missed the link:
https://github.com/fooblic/steem-flow
OK. Thank you!