Do Harder To Make Paper Airplanes Fly Further Than Paper Airplanes of a Lesser Difficulty? (A study conducted by Nicholas Cardenas)
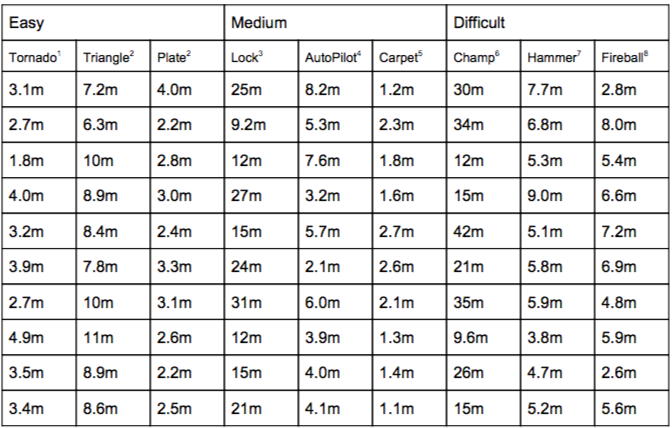
In this article, we seek to investigate whether or not paper airplanes that are more difficult to fold fly further than paper airplanes that are of a lesser difficulty to fold. In the field of paper airplane design and construction, there is a wide variety of designs that vary in shape, structure, and folding difficulty. The folding difficulty of a plane is related to how hard it is to keep all of the folds nice and crisp, the number of folds that have to be made, and how many layers of paper may have to be folded at once. Paper airplane enthusiasts often categorize designs as “Easy,” “Medium,” and “Hard,” in order to direct people to appropriate designs for their skill level. In order to study this question, three “Easy,” three “Medium,” and three “Hard” designs were selected. In each category was one glider-style design, meant to fly slowly with wide wings, one dart design, meant to move quickly with more sloped-back wings, and one gimmicky design, popular for their aesthetic value rather than their flying prowess. Ten of each plane were folded, brought to a football field, and flown under low-wind conditions. The lateral distance traveled was measured, to the nearest meter if the plane traveled more than ten meters and to the nearest tenth of a meter if the plane traveled less than ten meters, and recorded.
Related Research:
When looking for experiments, we only found one, which was conducted by a second grader. He did not provide us with information; however, it was an advanced experiment for a second grader(it was not a hypothesis test, although it looked nice with his display of the data). 10 We also researched designs of all the airplanes that we used to conduct the experiment. 1 2 3 4 5 6 7 8 In addition, we did some research on why paper airplanes fly. 11 We took the liberty of drawing a vector diagram with the forces acting upon the plane while in motion.
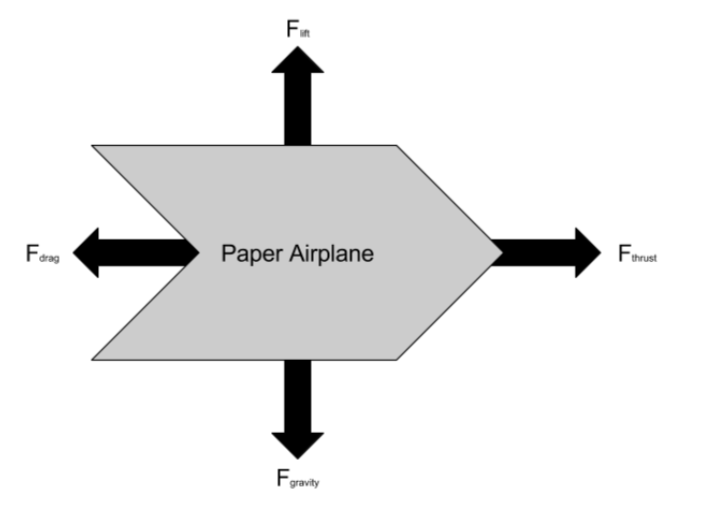
F-gravity is the force of gravity pulling down on the paper airplane at a constant 9.8 m/s^2.
F-lift is the result of Bernoulli's principle, which says that if air speeds up the pressure is lowered. The air goes faster over the plane causing a lower pressure over the plane, causing the plane to go up in the air.
F-thrust is the force of Jonathan throwing the plane in the air forwards.
F-drag is the negative force due to the air resistance caused by the plane.
Data:
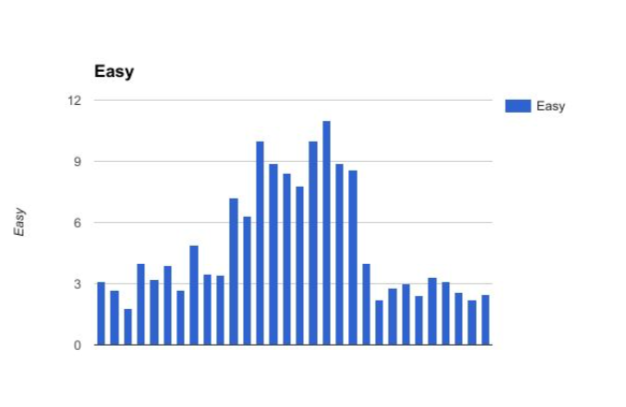
Easy:
n-Easy = 30
x̄-Easy = 4.94667 m
S-Easy = 2.88106 m
S^2-Easy = 8.30050 m^2
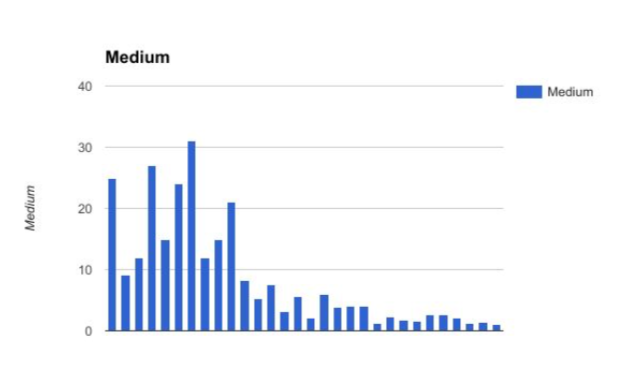
Medium:
n-Medium = 30
x̄-Medium = 8.64667 m
S-Medium = 8.77260 m
S^2-Medium = 76.95844 m^2
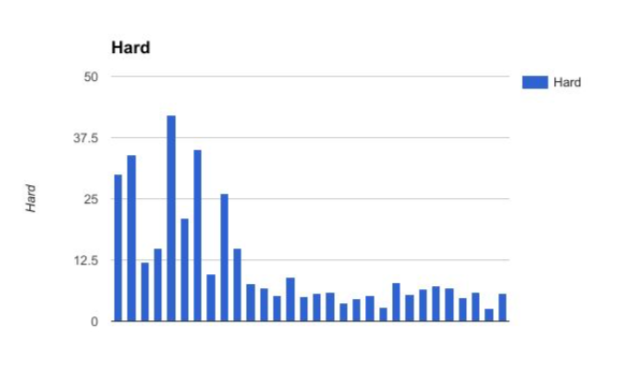
Difficult:
n-Difficult = 30
x̄-Difficult = 11.82333 m
S-Difficult = 10.77520 m
S^2-Difficult = 116.10530 m^2
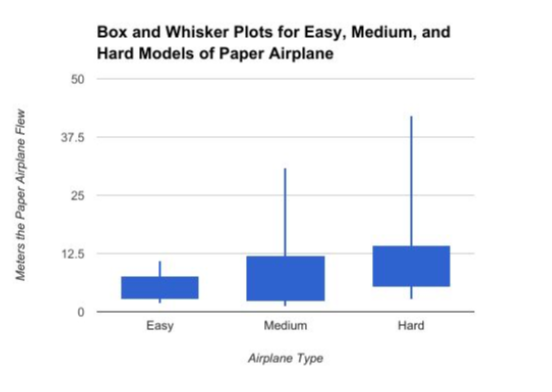
Summary of Results
| -- | Minimum | Lower Quartile | Upper Quartile | Maximum |
|---|---|---|---|---|
| Easy | 1.8 | 2.725 | 7.65 | 11 |
| Medium | 1.1 | 2.15 | 12 | 31 |
| Hard | 2.6 | 5.325 | 14.25 | 42 |
2 Sample T-Tests:
H0: μ Easy ≠ μ Medium
HA: μ Easy ≠ μ Medium
μ Easy = the true mean of the distances that the population of easy to make paper airplanes fly μ Medium = the true mean of the distances that the population of paper airplanes of medium difficulty fly
Conditions for a 2 Sample T Test:
● Samples of paper airplane by difficulty are representative of their populations of airplane
difficulty.
● The samples of paper airplanes are independent of each other.
● n Easy and n Medium are equal to thirty. This means that the Central Limit Theorem kicks in and the distribution of the sample means is approximately normal.
α = 0.05
T = -2.1948
P = 0.03487
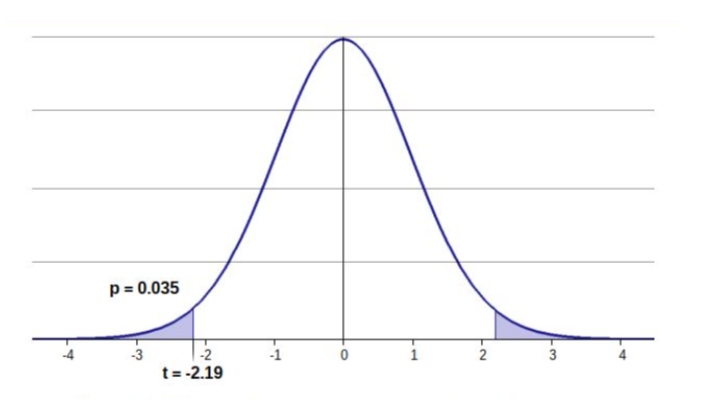
Since the p value of 0.03487 is less than the α of 0.05, I reject H0. There is sufficient evidence that the true mean of the distances that the planes fly between the population of easy and medium difficulty to make paper airplanes are different from each other.
H0: μ Medium = μ Difficult
HA: μ Medium ≠ μ Difficult
μ Medium = the true mean of the distances that the population of paper airplanes of medium difficulty fly
μ Difficult = the true mean of the distances that the population of hard to make paper airplanes fly
Conditions for a 2 Sample T Test:
● Samples of paper airplane by difficulty are representative of their populations of airplane
difficulty.
● The samples of paper airplanes are independent of each other.
● n Medium and n Difficult are equal to thirty. This means that the Central Limit Theorem kicks in and the distribution of the sample means is approximately normal.
α = 0.05
T = -1.25222
P = 0.21572
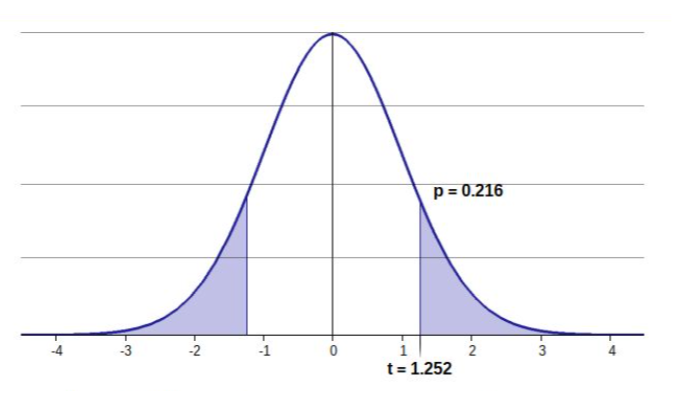
Since the p value of 0.21572 is greater than the α of 0.05, I fail to reject H0. There is sufficient evidence that the true mean of the distances that the planes fly between the population of medium and difficult to make paper airplanes do not differ from each other.
H0: μ Easy = μ Difficult
HA: μ Easy ≠ μ Difficult
μ Easy = the true mean of the distances that the population of easy to make paper airplanes fly
μ Difficult = the true mean of the distances that the population of difficult to make paper airplanes fly
Conditions for a 2 Sample T Test:
● Samples of paper airplane by difficulty are representative of their populations of airplane
difficulty.
● The samples of paper airplanes are independent of each other.
● n Easy and n Difficuly are equal to thirty. This means that the Central Limit Theorem kicks in and the distribution of the sample means is approximately normal.
α = 0.05
T = -3.3769
P = 0.00189
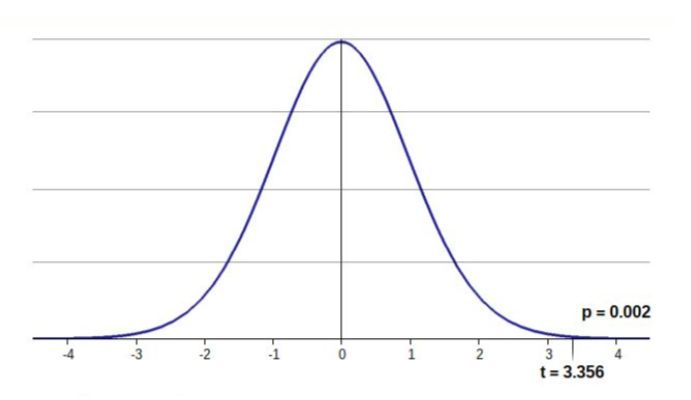
Since the p value of 0.00189 is less than the α of 0.05, I reject H 0. There is sufficient evidence that the true mean of the distances that the planes fly between the population of easy and difficult to make paper airplanes are different from each other.
ANOVA one-way F Test
H0: μ Easy = μ Medium = μ Difficult
HA: At least two μ’s differ
μ Easy = the true mean of the distances that the population of easy to make paper airplanes fly
μ Medium = the true mean of the distances that the population of paper airplanes of medium difficulty fly
μ Difficult = the true mean of the distances that the population of hard to make paper airplanes fly
Conditions for the ANOVA test:
● The samples of Easy, Medium, and Difficult paper airplanes are independent of each
other.
● The distributions are approximately normal - checked with box and whisker plot. Data is
not completely normal, however the ANOVA distribution is robust to the normality assumption. More simply, it tolerates these violations rather well. However a test must be run to confirm that the normality is not too far off.
● The variances are not similar to each other; in other words, it is not h omoscedastic . However the ANOVA distribution is known to be robust toward homoscedasticity when the numbers in the sample are equal to each other, and there are 30 trials in each sample. However, we will run the Bartlett's Test for Equal Variances to check.
s^2 Easy = 8.30050 m^2
s^2 Medium = 76.95844 m^2
s^2 Difficult = 116.10530 m^2
α = 0.05
F = 5.29412
P = 0.006765
Factor:
df = 2
SS = 710.698
MS = 355.349
Error:
df = 87
SS = 5839.56
MS = 67.1214
Sxp = 8.19277
Conclusion: Since the p value of 0.006765 is less than α of 0.05, I reject H0. There is sufficient evidence that there is a significant difference between the true mean of the distance that the Easy, Medium and Difficult groups that the planes traveled.
Bartlett’s Test for Equal Variances:
H0: σ easy ^2 = σ medium ^2 = σ difficult ^2
HA: At least two σ^2 ’s differ
No conditions or assumptions used in this test.
n Easy = 30
s^2 Easy = 8.30050 m^2
n Medium = 30
s^2 Medium = 76.95844 m^2
n Difficult = 30
s^2 Difficult = 116.10530 m^2
α = 0.05
df = 2
critical value: X2 = 7.37776
critical value region: T > 7.37776
T = 40.44754
P = 0.00000
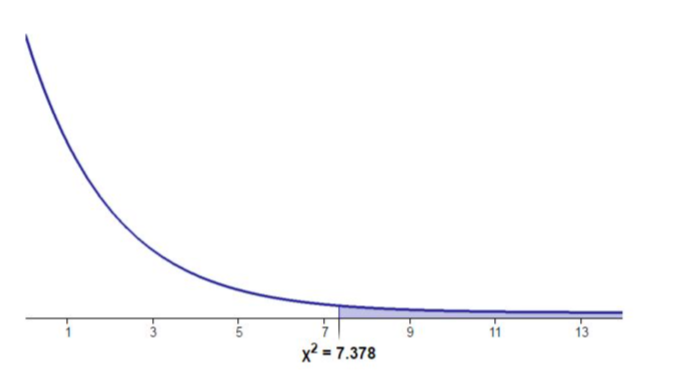
Since the test statistic of 40.44754 is larger than the critical value of 7.3776, I reject H0 at the 0.05 significance level. There is sufficient evidence that one of the variances is different from the other variances.
Conclusuion:
Based on our findings in the experiment, we have found two different answers to our original question: easy paper airplanes planes travel less distance than difficult paper airplanes, but medium difficulty paper airplanes travel a similar amount of distance as difficult paper airplanes. We ran three 2 sample t tests, comparing the true means between easy and medium groups, medium and difficult groups, and easy and difficult groups respectively to see if the true mean of the distances that the plane traveled were different. We had sufficient evidence that the true mean between the easy and medium groups, and the easy and difficult groups were different from each other. However between the medium and difficult groups, we had gotten that the true means did not differ from each other, causing us to think that we have two answers. We also ran a one way ANOVA F-Test, and that gave us more conclusive results, that at least two of the true means were not equal to each other. There was doubt about the equal variances, which is one of the conditions for ANOVA, so we ran the Bartlett's Test for Equal Variances and got a test statistic of 40, showing that the variances are clearly not equal to each other, questioning the validity of our ANOVA answer. The data also looked skewed to the right for the medium and hard groups questioning if a T test is appropriate as well.
There were several potential issues or sources of error or bias in our experiment. For one, the low number of designs meant that our planes were quite possibly non-representative of their categories. For another, the significant time delay between the folding of the planes and their flight meant that planes with more folds didn’t flatten out as much, and held a crisper shape than planes with fewer folds, potentially biasing the experiment towards difficult planes. Because the flights were conducted outside, certain environmental factors such as temperature, humidity, pressure, or wind may have played biasing roles in the experiment, however we attempted to reduce these factors as much as possible.
Were the experiment to be conducted again, we would seek to do the flights inside, with a greater number of airplane designs, and going more quickly from folding to flying. We would also run the Mann-Whitney U test instead of the 2 sample T tests because there is reasonable doubt about the data's normality and the Mann-Whitney U test does not require the assumption of normal distributions, unlike the t test, which does. Also, instead of doing an ANOVA F test, we would do a Kruskal–Wallis one-way analysis of variance, which also does not require the assumption of normal distributions, unlike ANOVA, which does.
Works Cited:
[1] "Awesome Paper Airplanes – Hurricane." Paper Plane Mafia. N.p., 14 June 2014. Web. 22 May 2017.
[2] Stechkovich, Maria. "How to Make a Simple Paper Airplane." WikiHow. WikiHow, 30 May 2017. Web. 22 May 2017.
[3] FlutterTree. "Paper Airplane: the Nakamura Lock." Instructables.com. Instructables, 12 May 2016. Web. 22 May 2017.
[4] "FUN PAPER AIRPLANES." Free Paper Airplane Designs-Printable Templates . N.p., n.d. Web. 22 May 2017. Bulldog
[5] Smilo75. "SPACE BUS paper airplane No.7." YouTube. YouTube, 07 June 2013. Web. 22 May 2017.
[6] O'Reilly, Michael. Paper airplane - The best paper airplane in the world! Zurqui, 5 Oct. 2013. Web. 22 May 2017.
[7] Anderberg, Jeremy. "The Best Paper Airplane: How to Make a Paper Airplane." The Art of Manliness. N.p., 22 May 2017. Web. 22 May 2017.
[8] Dewar, Andrew. Ultimate paper airplanes for kids. Tokyo: Tuttle publishing, 2015. Print.
[9] Blackburn, Ken. "Paper Airplane Aerodynamics." Paper Airplanes. Emerald Coast Creative, 2008. Web. 22 May 2017.
[10] Bowdler, Alex. "The Long Flight." (n.d.): n. pag. Web.
[11] "What Makes Paper Airplanes Fly?" Scholastic. Scholastic Books, n.d. Web.