
Welcome to my daily analytical report about Steemit.
All the information presented in this report are based on the data collected from the blockchain until 2017-07-06 midnight UTC time. The goal of this report is to provide you with a clear view on what is happening daily on Steemit.
1. New users
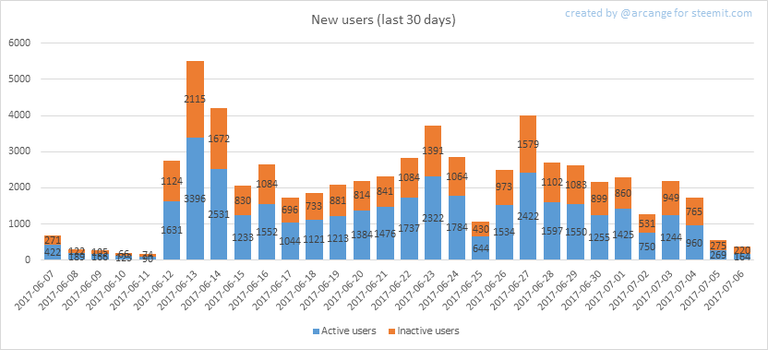
This chart shows the number of newly registered users on Steemit and how many of them became active. We see that a lot of accounts are registered, but never used.
Warning: this graphic is kind of dynamic! A user can register one day and become active a few days later. Therefore, the number of active users on a specific date may change from day to day.
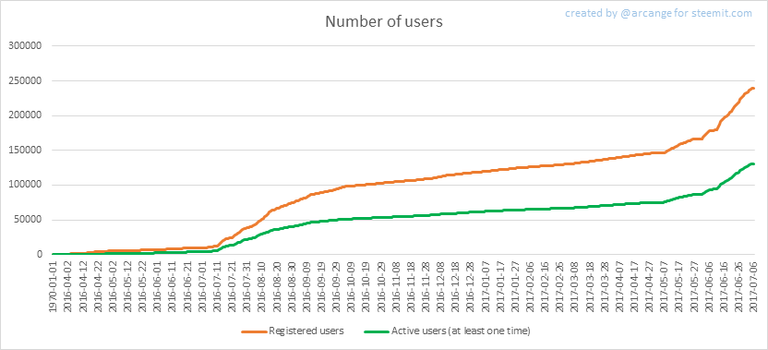
In this graph, the orange line shows the total number of registered accounts.
The green line shows how many of them have been active at least once (by active, I mean those who made at least one post, comment Or upvote). They are included even if they become inactive later.
2. Post And comments

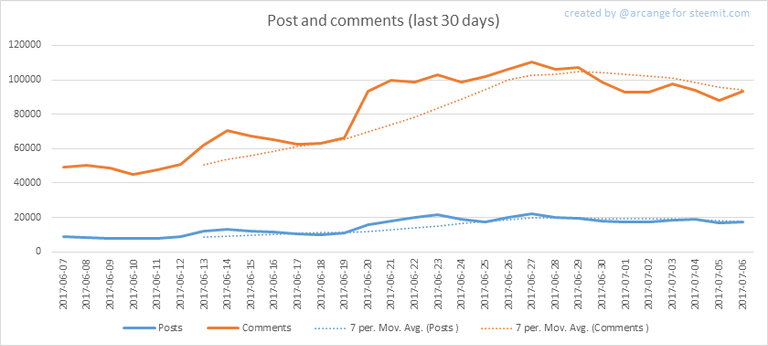
These graphs show the evolution of posts and comments for the whole blockchain lifetime and for the last 30 days.
3. Curation
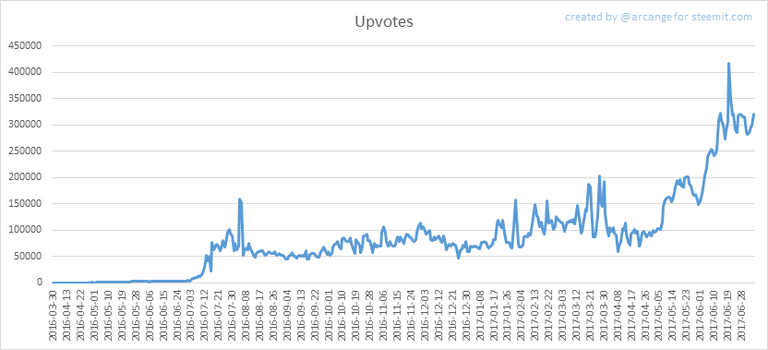
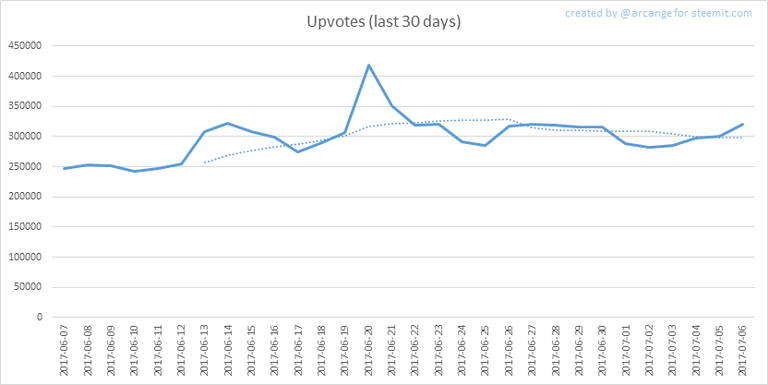
These graphs show the evolution of curation (upvotes) for the whole blockchain lifetime and for the last 30 days
4. Active users
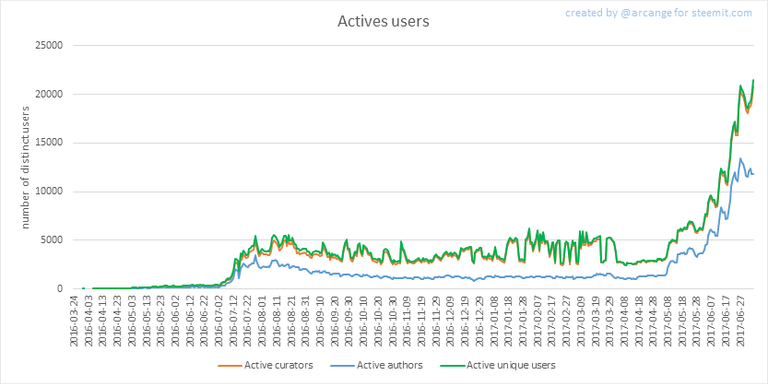
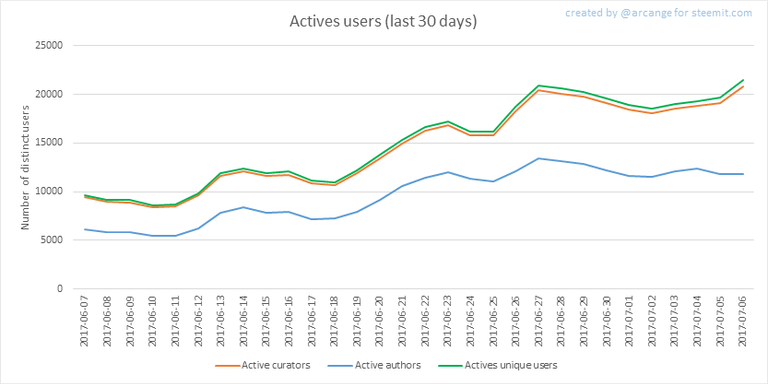
These graphs show the activity of users over time and in more details for the last 30 days.
5. Daily transactions
![]()
This graph shows the number of daily transactions. This give you an idea of the whole activity on the blockchain.
6. Categories
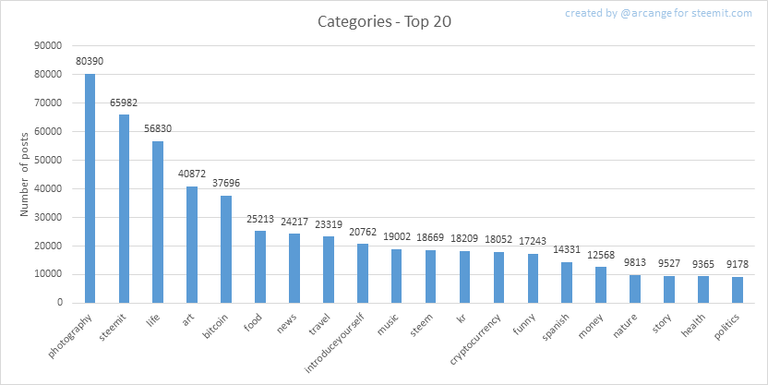
This graph shows the tag has been the most used for publishing posts for the whole blockchain lifetime.
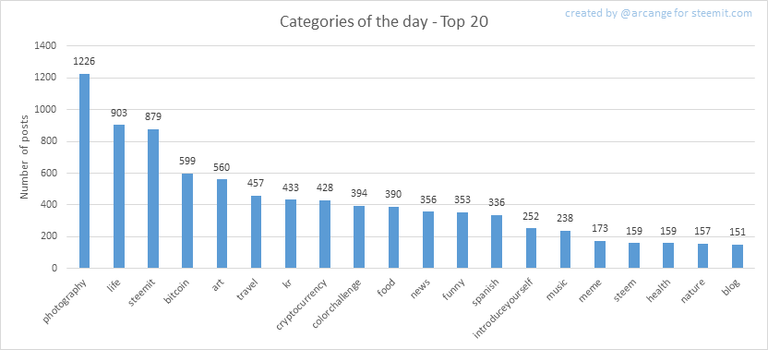
This graph shows the tag has been the most used for publishing posts last day.
7. Distribution
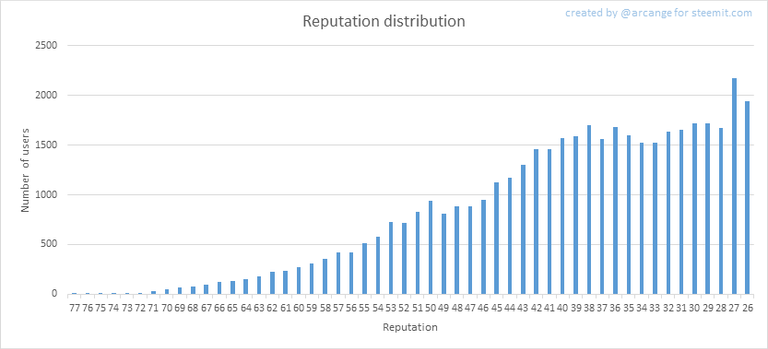
This graph shows the distribution of the reputation among users. Accounts with a reputation lower than 25 have been removed to keep the graph readable.
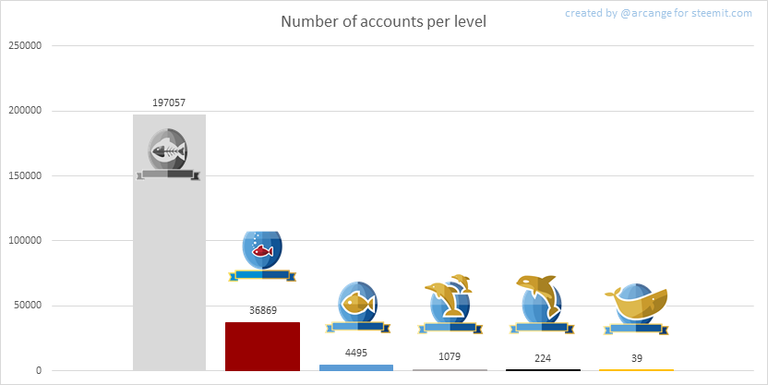
This graph shows the number of users according to their voting power (it now includes the new "Inactive" and "Red Fish" levels - check @steemitboard blog for more info about this).
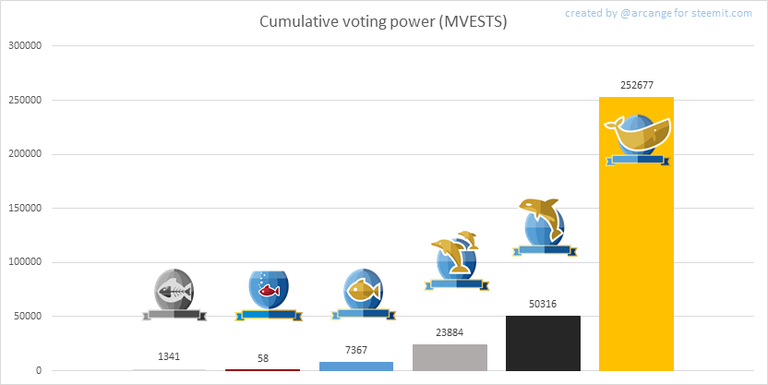
This graph shows cumulative distribution of the voting power. It enables to see the total voting power of each level. One will notice that, despite their large numbers, all other categories do not carry much weight against all whales.
8. Payout evolution
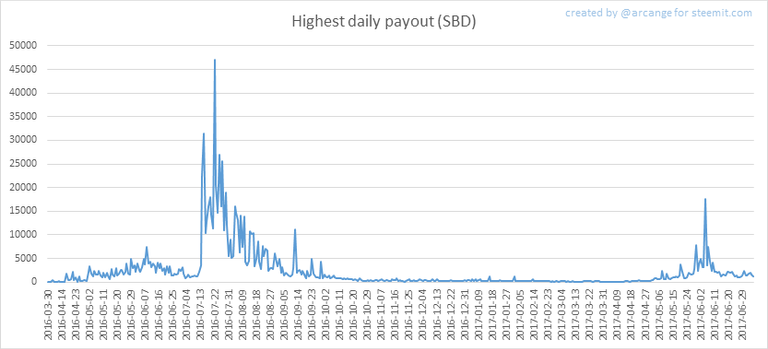
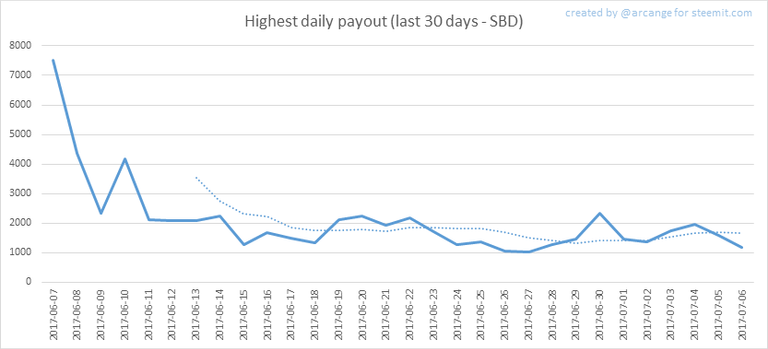
These graphs show the maximum reward paid on a post (or comment) for each day (whole blockchain life and last 30 days).
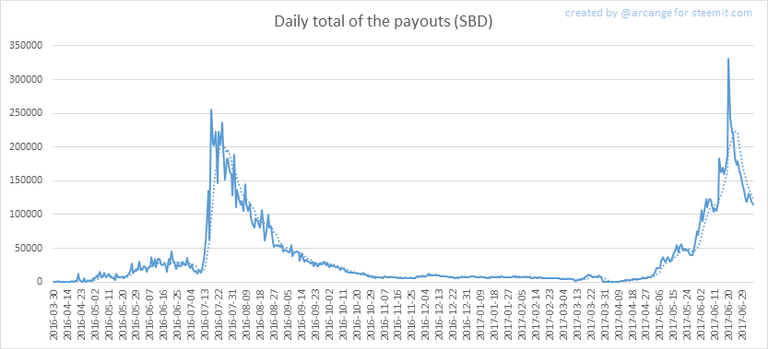
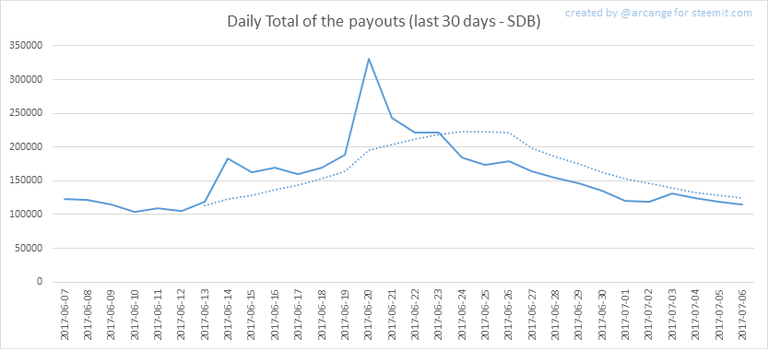
These graphs show the total of the distributed payout (posts and comments) for each day.
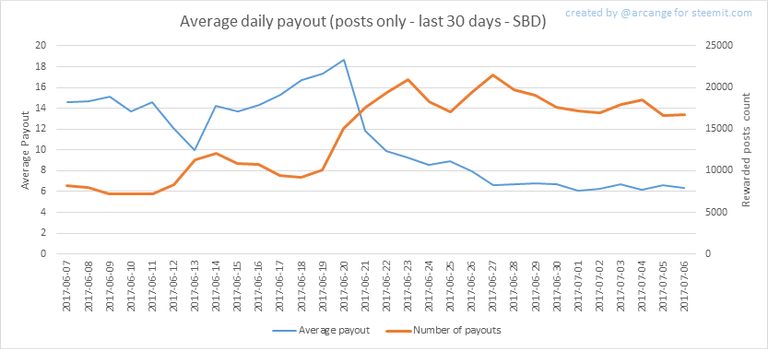
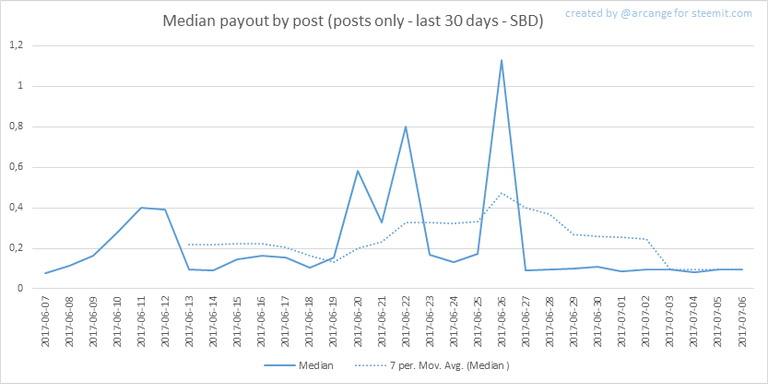
These graphs show the average and median payout per post for the last 30 days.
The last one indicates that if yesterday you got the latest value shown on this chart for your post, you should be happy because there are as much people that have earned more than you than people that have earned less than you.
I hope you find those stats useful. If you would like to see different stats, feel free to drop me a comment. Your feedback is more than welcome.
Thanks for reading.

footer created with steemitboard - click any award to see my board of honor
Support me And my work as a witness by voting for me here!

You Like this post, do not forget to upvote Or follow me Or resteem
Loving the post mate. The funniest thing is that by making a post detailing about how Steemit has grown, you've helped it grow a little bit more haha
Yep, it is the snowball effect =)
Hi thanks for this, I just found your page and started following you :) I was actually looking for something like this for some time now. Question: any idea why I don't get notifications when people I follow shares new posts on steemit? This started happening 2 days ago. Also, now when I post something it doesn't automatically get upvoted by myself like it used to. This also started happening two days ago. Anybody knows why? Cheers & happy blogging xx
I respact you and know I am vote you, thanks you
Thank you, I'm interested! )
Great post and the graphs are doing it for me. I am understanding things better. Thank You
Thank you very much for this post.
I always read those statistics thanks a lot for sharing and keep on posting ;)
Too complex to read.
Really fascinating info, graphs make it easy to see the trends, I hope you will keep them coming!
Thanks for statistic
Have a great and sunny weekend
I love the post!!! Thank you so much!
Interesting statistic. It"s going well for Steemit.
@arcange Do you have any network stats?
If Steemit grows exponentially it would need exponential network resources.
Considering myself if I should contribute to the network, but hard to find actual information. Need to be a witness? Cost for hardware, bandwidth etc vs earnings?