
Welcome to my daily analytical report about Steemit.
All the information presented in this report are based on the data collected from the blockchain until 2017-07-04 midnight UTC time. The goal of this report is to provide you with a clear view on what is happening daily on Steemit.
1. New users
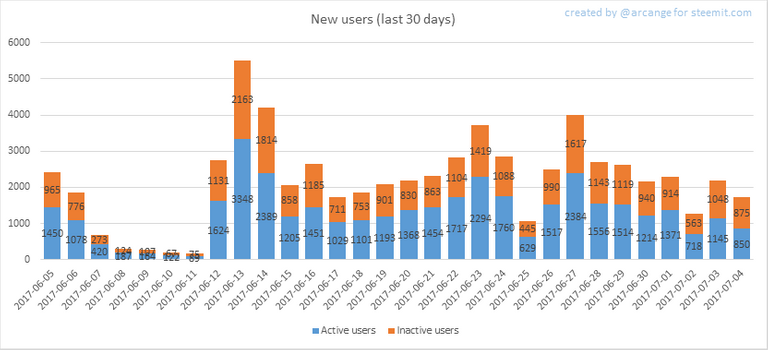
This chart shows the number of newly registered users on Steemit and how many of them became active. We see that a lot of accounts are registered, but never used.
Warning: this graphic is kind of dynamic! A user can register one day and become a few days later. Therefore, the number of active users on a specific date may change from day to day.

In this graph, the orange line shows the total number of registered accounts.
The green line shows how many of them have been active at least once (by active, I mean those who made at least one post, comment or upvote). They are included even if they become inactive later.
2. Post and comments


These graphs show the evolution of posts and comments for the whole blockchain lifetime and for the last 30 days.
3. Curation
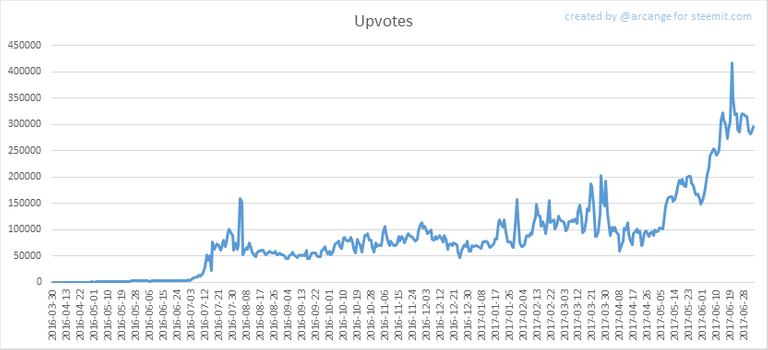

These graphs show the evolution of curation (upvotes) for the whole blockchain lifetime and for the last 30 days
4. Active users
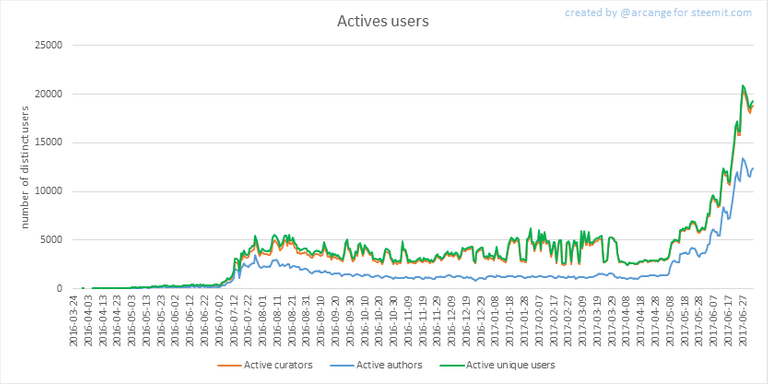
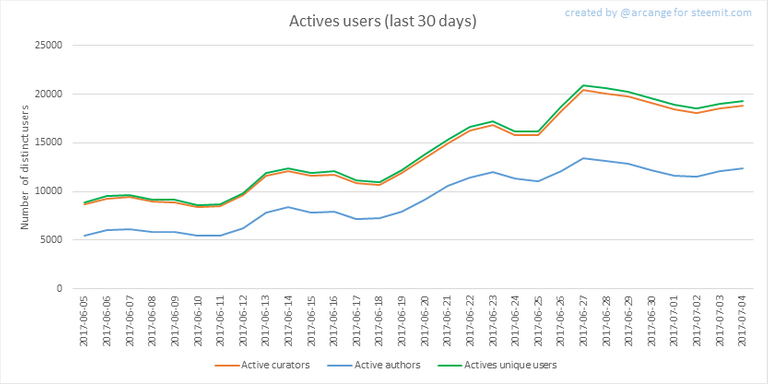
These graphs show the activity of users over time and in more details for the last 30 days.
5. Daily transactions
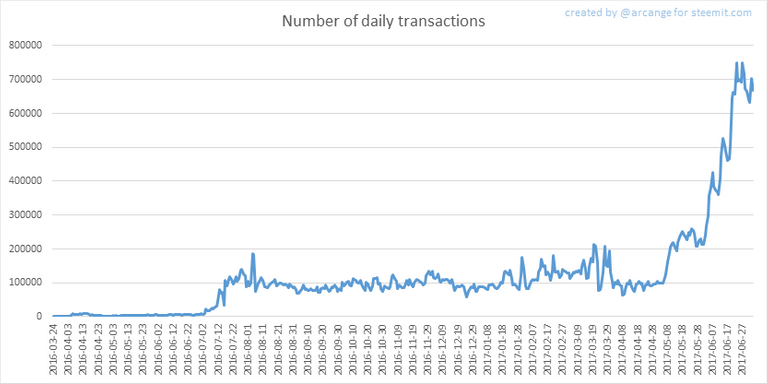
This graph shows the number of daily transactions. This give you an idea of the whole activity on the blockchain.
6. Categories

This graph shows the tag has been the most used for publishing posts for the whole blockchain lifetime.
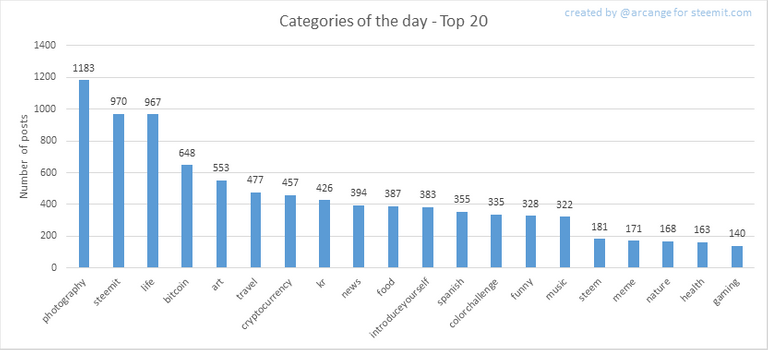
This graph shows the tag has been the most used for publishing posts last day.
7. Distribution
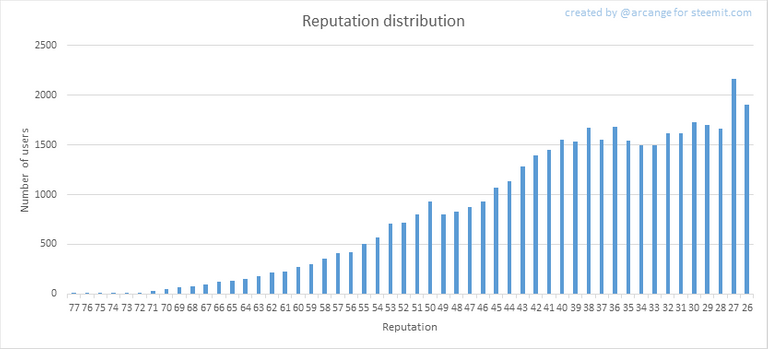
This graph shows the distribution of the reputation among users. Accounts with a reputation lower than 25 have been removed to keep the graph readable.

This graph shows the distribution of the voting power (it now includes the new "Inactive" and "Red Fish" levels - check @steemitboard blog for more info about this).
8. Payout evolution
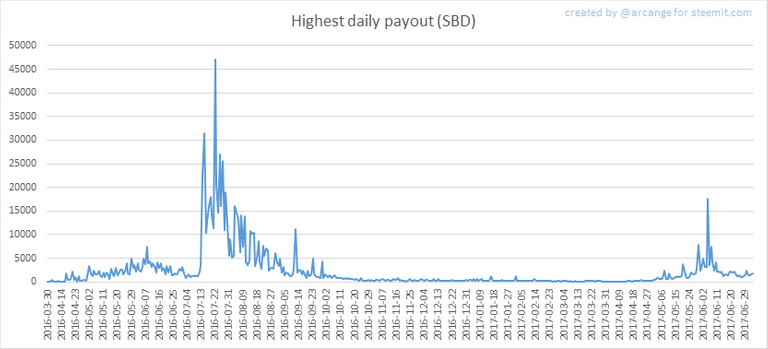

These graphs show the maximum reward paid on a post (or comment) for each day (whole blockchain life and last 30 days).
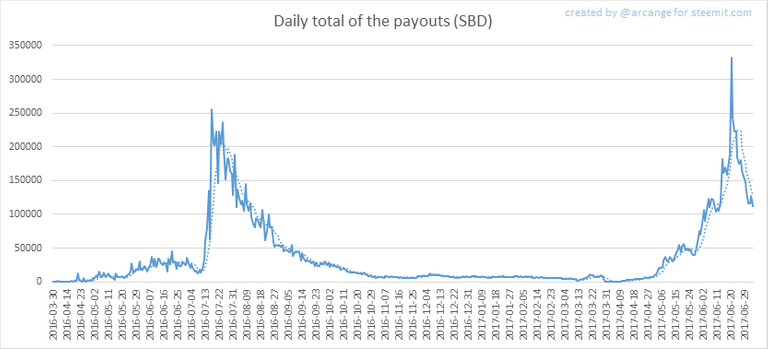
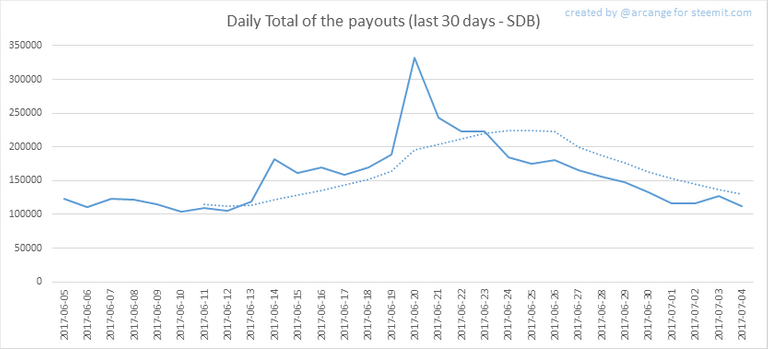
These graphs show the total of the distributed payout (posts and comments) for each day.
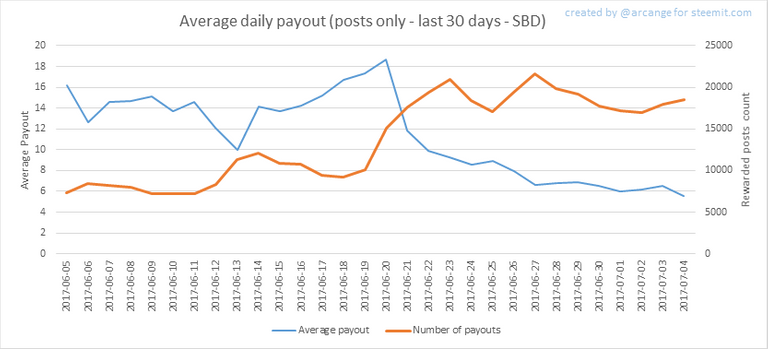
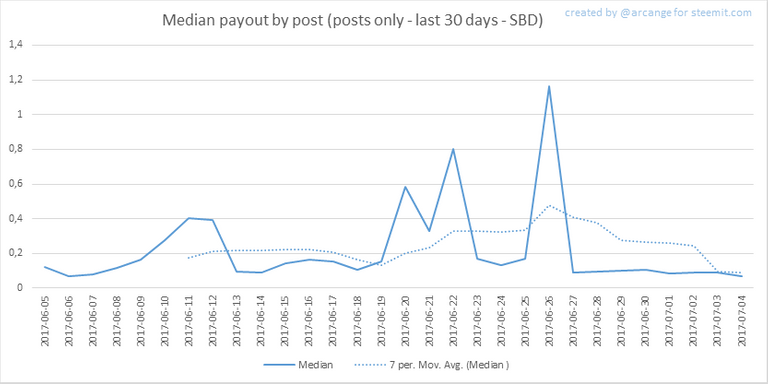
These graphs show the average and median payout per post for the last 30 days.
The last one indicates that if yesterday you got the latest value shown on this chart for your post, you should be happy because there are as much people that have earned more than you than people that have earned less than you.
I hope you find those stats useful. If you would like to see different stats, feel free to drop me a comment. Your feedback is more than welcome.
Thanks for reading.
Happy Birthday, Steemians! Read more here...

footer created with steemitboard - click any award to see my board of honor
Support my work as a witness by voting for me here! 

Congratulations @arcange ! You've just been featured in my Daily STEEM & SBD Report with your post. You can find it here:
Thank you and keep it up!
Great stuff with these posts! I was wondering if it's possible to show average views per post? In whatever way - either from when the post was created up until when you make your graph or on an ongoing daily metric. Meaning approx 16,000 posts created yesterday, which were viewed in total X times, making the average view per post Y.
I think it would be an interesting metric to observe average content consumption.
That would be really interesting to see, indeed. It is not uncommon to encounter posts which have more votes than views when it comes to more established authors here on steemit.
Unfortunately, the view metrics are not part of the blockchain and I can't a report on it.
They are related to the client. Some use steemit.com, other busy.org or eSteem, ...
The only thing we have in the blockchain is the name of the client used to create a post. But it won't help for your request.
Oh I see. I was wondering because it would be useful metric to contrast with the average CPM websites are getting for using AdSense. You know you could see how much the content is overpaid or underpaid if it was monetized by traditional display advertising at market rates.
goood.I like it very much
Thanks!
Thank you for these great update post. It is extremely valuable to able to see all this info in one place. I'm glad to see the growth that is happening here.
Thank you for these data. Valuable info. Following
Thank you =)
That is a great idae @arcange following you and upvoted.
Thank you!
Thank you, @arcange! Where can i find information about meaning of badges? Does it have meaning or it is just an element of gamification?
Simply click on any badge on you board and it will popup a description window
The grafts are a little small for me to see, but it looks like total registered steemians is about 250,000 is that correct? And registration has gone from 150,000 to 250,000 in about 5 months. That is out of sight if true. Thanks for posting all these figures.
No, registration has jumped from 150,000 to 250,000 users in 2 months
Fantastic! tks for info.
How do i turn the Steemit board comments back on?
Reply to the last notification you received from @steemitboard with the word
NOTIFYGood info as always-- it's cool to see that we are actually staying around 20,000 active daily users now... that's pretty impressive, compared even to just a month ago. Thanks for bringing us these reports!
Yep, recent growth of Steemit is amazing.
Thanks for your comment.