
Welcome to my daily analytical report about Steemit.
All the information presented in this report are based on the data collected from the blockchain until 2017-06-29 midnight UTC time. The goal of this report is to provide you with a clear view on what is happening daily on Steemit.
1. New users
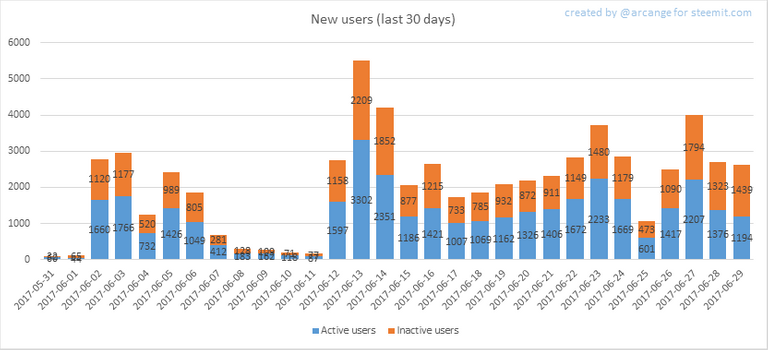
This chart shows the number of newly registered users on Steemit and how many of them became active. We see that a lot of accounts are registered, but never used.
Warning: this graphic is kind of dynamic! A user can register one day and become a few days later. Therefore, the number of active users on a specific date may change from day to day.
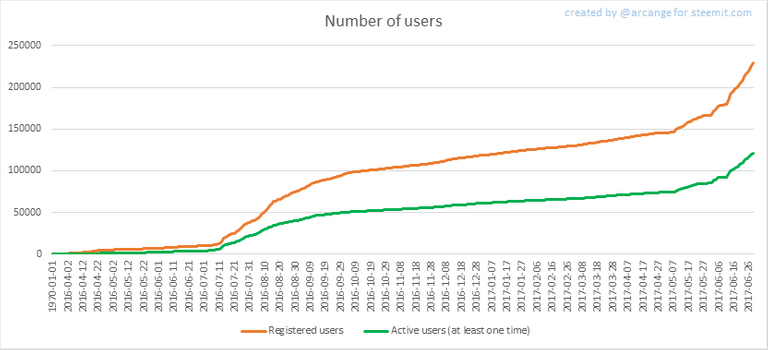
In this graph, the orange line shows the total number of registered accounts.
The green line shows how many of them have been active at least once (by active, I mean those who made at least one post, comment or upvote). They are included even if they become inactive later.
2. Post and comments
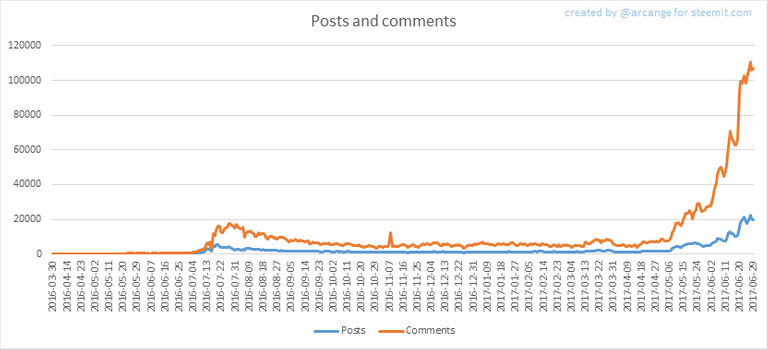
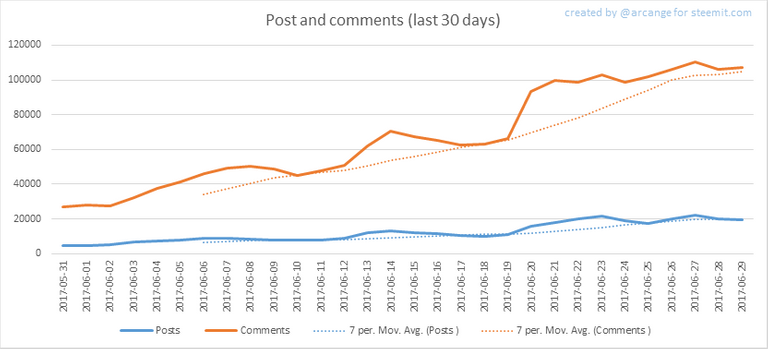
These graphs show the evolution of posts and comments for the whole blockchain lifetime and for the last 30 days.
3. Curation
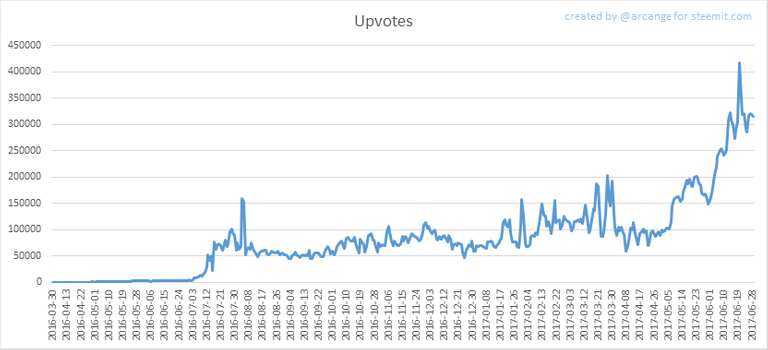
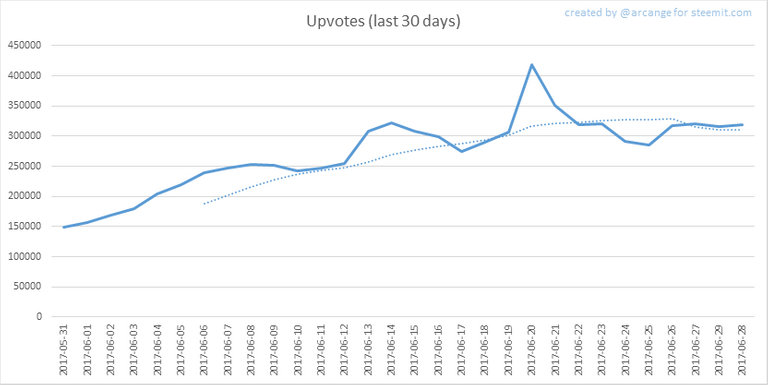
These graphs show the evolution of curation (upvotes) for the whole blockchain lifetime and for the last 30 days
4. Active users
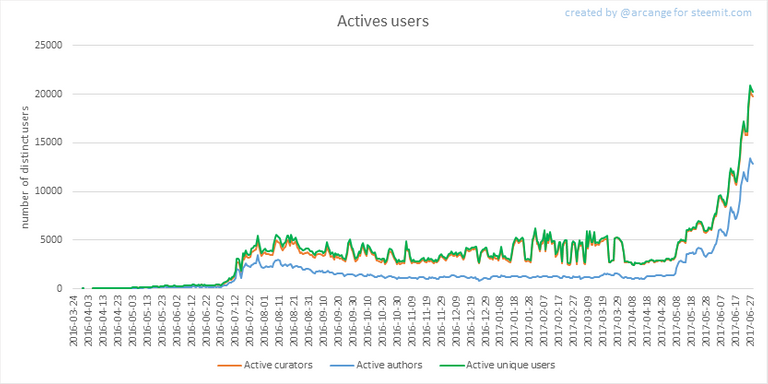

These graphs show the activity of users over time and in more details for the last 30 days.
5. Daily transactions
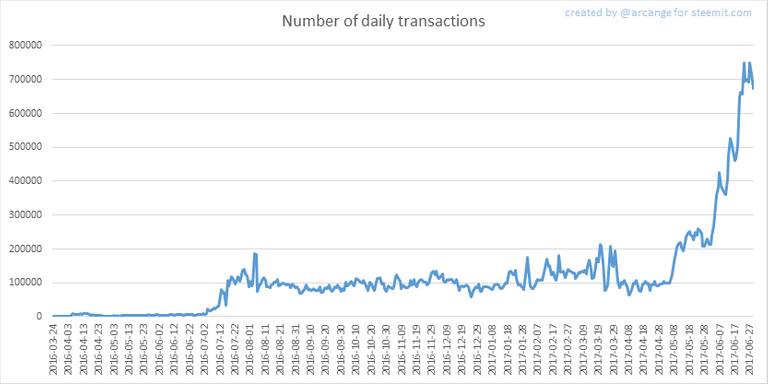
This graph shows the number of daily transactions. This give you an idea of the whole activity on the blockchain.
6. Categories
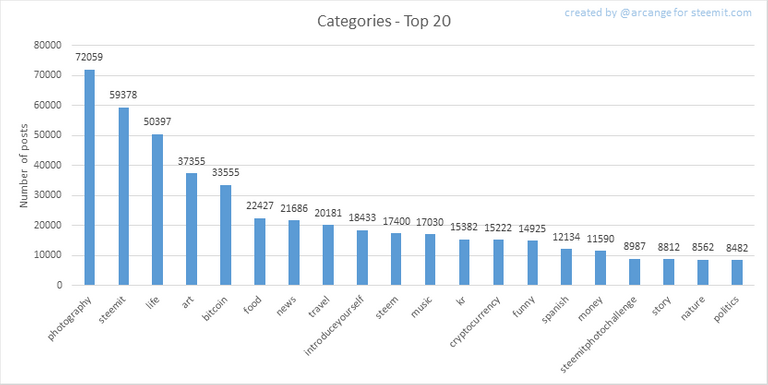
This graph shows the tag has been the most used for publishing posts for the whole blockchain lifetime.
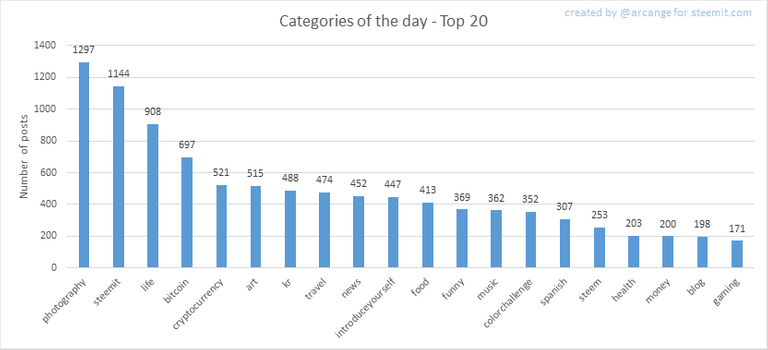
This graph shows the tag has been the most used for publishing posts last day.
7. Distribution
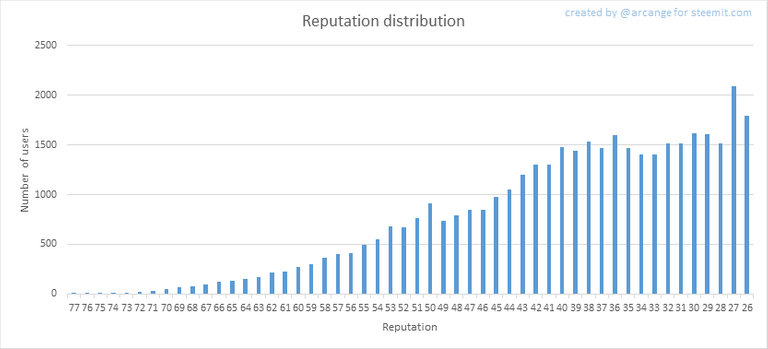
This graph shows the distribution of the reputation among users. Accounts with a reputation lower than 25 have been removed to keep the graph readable.
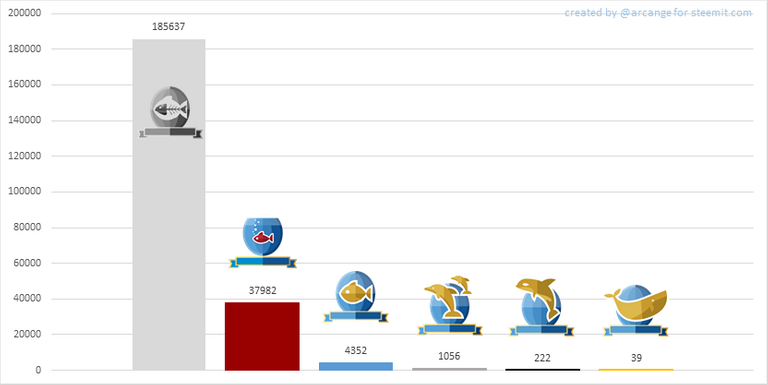
This graph shows the distribution of the voting power (it now includes the new "Inactive" and "Red Fish" levels - check @steemitboard blog for more info about this).
8. Payout evolution


These graphs show the maximum reward paid on a post (or comment) for each day (whole blockchain life and last 30 days).
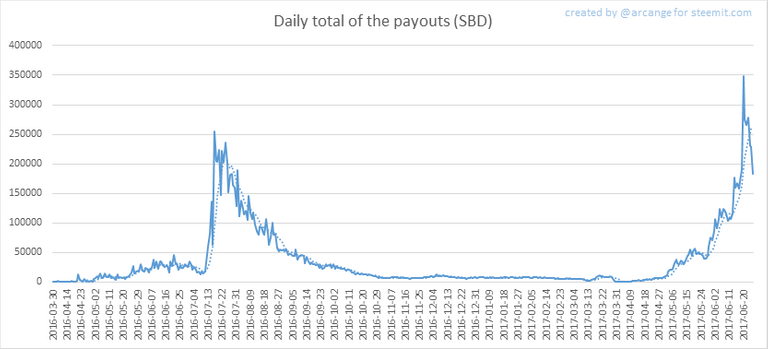

These graphs show the total of the distributed payout (posts and comments) for each day.
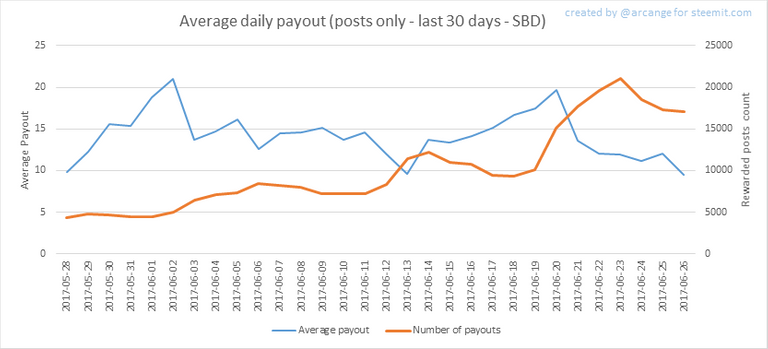
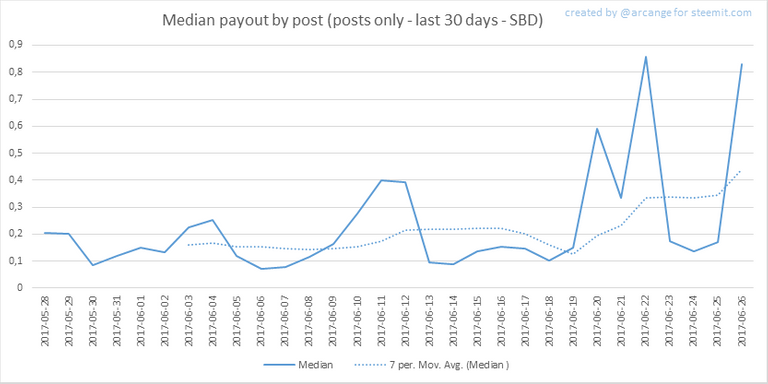
These graphs show the average and median payout per post for the last 30 days.
The last one indicates that if yesterday you got the latest value shown on this chart for your post, you should be happy because there are as much people that have earned more than you than people that have earned less than you.
I hope you find those stats useful. If you would like to see different stats, feel free to drop me a comment. Your feedback is more than welcome.
Thanks for reading.
Happy Birthday, Steemians! Read more here...

footer created with steemitboard - click any award to see my board of honor
Support my work as a witness by voting for me here! 

it's morning and things are always growing here.(new users) lol good to see the new hardfork is working :) get it jejeje
@arcange,
Thank you for sharing this statistic, this give us information of where we going as we continue to invest in STEEM.
Cheers,
@Yehey
Just in case you want to read. I created my own cryptocurrency QUE coins. Please read Vote Up and Resteem so other entrepreneurs know about it.
https://steemit.com/ethereum/@yehey/i-created-my-own-crypto-currency-que-coins
Thank you.
great! Thank you for sharing
@arcange u shear so intrestin and usefull information it helps a lot as am new to steemit and i don't know much about it so your posts i found are intresting and helpfull.. u deserve an foollow and an big upvote for this ..thank you bro.
p.s i started following u
have a visit to my blog @naseerbhat and do follow,upvote and resteem my posts
Thank You
Just featured your post in my Daily STEEM & SBD Price Report @arcange !
You can find it here...

Thank you and keep it up!
Thanks for the mention in your post!
Impressive work! So, the inactive status of any user is a user who does not login, comment or upvote, right?
No, login as nothing to do with "inactive" status.
Inactives are users who do not post, comment or upvote for more than 7 days
thanks for the clarification :)
I look forward to these, it's my little learning tool haha
Happy Friday ⭐️
Thank you! Glad to help you to learn ;)
Greate work it took lots of research and hard work to do that keep it up good work.
Thanks!
I like your stats. You should do them more interactive ;)
Can I make them too? :D I hear I can use sql but all the time i have timeout :(
That might be because you use poorly written queries or request too much data.
I understand, this can be resonable... but I dont have chance to set any request :D I cant login, have timeout when login
Very good, thanks.
I notice you don't give any opinions about the data and trends. So is it OK to write about any trends, linking back to your data?
Of course, my opinions do not rule and you may write about your own as long as you mention your source if any.
I can't even imagine how much time you spend compiling all this stats that is good for morale and also great for understanding trends on steemit. No mean feat that should be applauded :)
Thank you!
Wow the charts goes crazy since hard fork 19. Posts, comments and votes through the roof.
To the moooooon!
impressive work of compiling at the data.
Thanks!
interesting as ever! ;)
Added Witness vote! Keep it up! @arcane
NICE, well done stats, please keep it up!
AWESOME!!!!!
Okay, so your reputation distribution graph seems to show that less than 20,000 people have reputations greater than 36. Am I reading that right?
You were not far. As of NOW, there are 24026 accounts with a reputation higher or equal to 36.
Thank you. So much opportunity.
dear @arcange : everything is increasing since 19th fork but total payout is decreasing. How is that possible?
Wow! payouts are at record levels. Or am I misunderstanding?
@arcange can you provide a current chart like this one, which is from just before HF19?