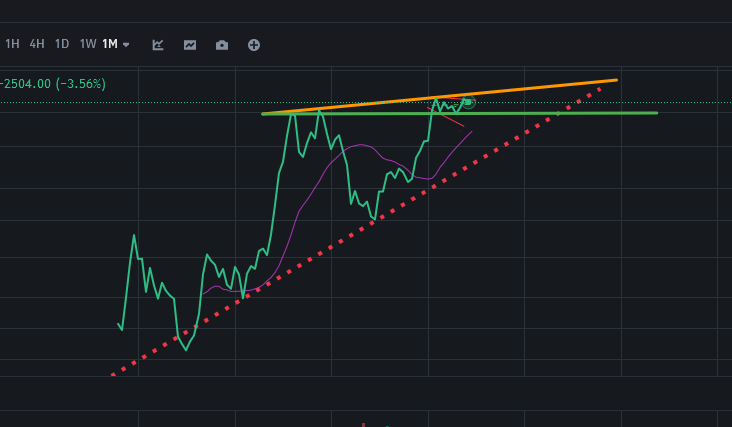
I just discovered that you could watch a chart in something else than candles... And weirdly it paint a completely different but way simpler picture of the bitcoin situation. This is on the monthly. Do you think that we (green) broke the resistance and are testing support or (yellow) still trying to break resistance?
Posted using SoMee
You can query your personal balance by
!DIYSTATS!DIY