In this article I look at the highest paid posts on Steemit in the area of Science & Technology and various statistics around payments under the tags "science" and "technology".
The is part of a series of posts covering Payout statistics in different areas. If you would like to see these stats from previous posts, the links are given below:
This post recognises the authors whose content was very well received by the Steemit community. Links to the original posts are given for this who missed them first time round.
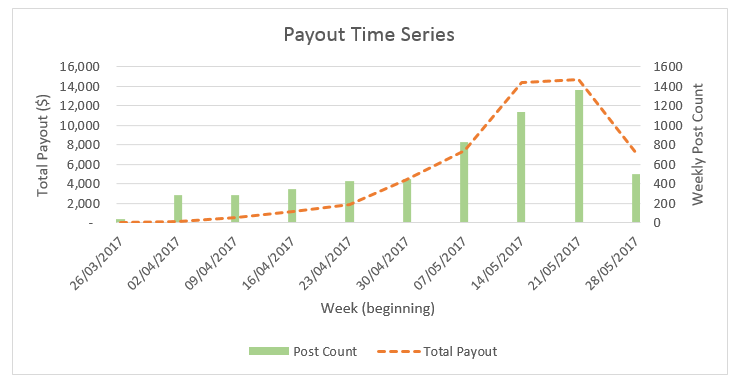
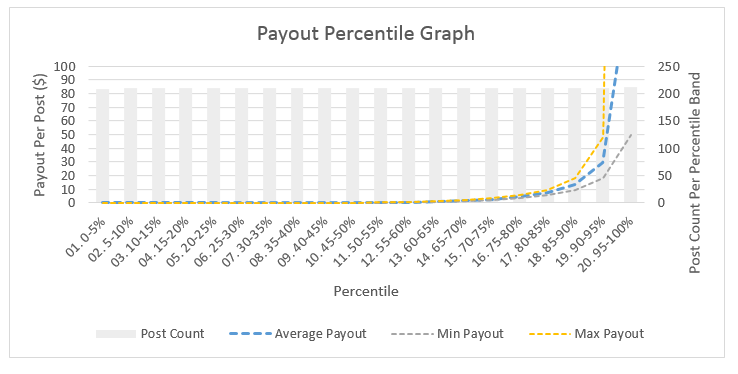
I also provide statistics on the distribution of payouts by percentile, how payouts in this category have changed since the start of April and some other interesting results.
I've analysed data from Steemdata on every post with science and technology-related tags from the 1st April to 31st May.
So...here are the results:
Table 1 - Top Science/Technology Post Payouts on Steemit
| Author | Post Link | Payout | Votes | Title |
|---|---|---|---|---|
| @timsaid | Link | 1179 | 875 | Myth Or Fact 17 Cockroaches Can Survive A Nuclear Catastrophe |
| @timsaid | Link | 1019 | 641 | Myth Or Fact 16 Skin On Heated Milk Is Dangerous |
| @timsaid | Link | 1012 | 505 | Myth Or Fact 22 You Have To Wait An Hour To Swim After Eating |
| @timsaid | Link | 886 | 761 | Myth Or Fact 20 A Penny Dropped Off The Empire State Building Kills You |
| @timsaid | Link | 873 | 695 | Myth Or Fact 18 Hair And Nails Keep Growing After Death |
| @jrcornel | Link | 836 | 437 | U S Defense Finding Use Cases For Blockchain Technology |
| @infovore | Link | 763 | 637 | The Future Of Work Being On The Good Side Of Ai The Centaur Way |
| @kingscrown | Link | 761 | 691 | Opendime The Way To Trade Bitcoin Off Chain And 100 Anonymous |
| @ilvacca | Link | 661 | 835 | Astrophotography The Milky Way Core |
| @timsaid | Link | 637 | 664 | Myth Or Fact 20 Stretching Before Exercise Is Dangerous |
Table 2 - Top Earners from Science/Technology Posts
| Author | Post Count | Payout | Average Payout Per Post |
|---|---|---|---|
| @timsaid | 8 | 6596 | 824.44 |
| @sirwinchester | 27 | 280 | 103.69 |
| @justtryme90 | 14 | 2725 | 194.63 |
| @cherish5528 | 60 | 2709 | 45.15 |
| @doitvoluntarily | 68 | 2691 | 39.58 |
| @sauravrungta | 16 | 2596 | 162.23 |
| @calaber24p | 10 | 160 | 167.66 |
| @kingscrown | 4 | 1328 | 331.98 |
| @kyriacos | 7 | 1096 | 156.51 |
| @jrcornel | 1 | 836 | 836.17 |
Table 3 - Weekly Payout Stats
| Week | Post Count | Total Payout | Average Payout Per Post |
|---|---|---|---|
| 13 | 37 | 15 | 0.41 |
| 14 | 281 | 146 | 0.52 |
| 15 | 282 | 483 | 1.71 |
| 16 | 343 | 1151 | 3.36 |
| 17 | 431 | 1803 | 4.18 |
| 18 | 445 | 4429 | 9.95 |
| 19 | 828 | 7420 | 8.96 |
| 20 | 1136 | 14357 | 12.64 |
| 21 | 1359 | 14713 | 10.83 |
| 22 | 497 | 7144 | 14.37 |
Table 4 - Payout Distribution
| Percentile | Post Count | Total Payout | Average Payout Per Post | Min Payout in Percentile Band | Median Payout in Percentile Band | Max Payout in Percentile Band |
|---|---|---|---|---|---|---|
| 01. 0-5% | 209 | 00 | 0.00 | 0.00 | 0.00 | 0.00 |
| 02. 5-10% | 210 | 00 | 0.00 | 0.00 | 0.00 | 0.00 |
| 03. 10-15% | 211 | 00 | 0.00 | 0.00 | 0.00 | 0.00 |
| 04. 15-20% | 210 | 00 | 0.00 | 0.00 | 0.00 | 0.00 |
| 05. 20-25% | 210 | 01 | 0.00 | 0.00 | 0.00 | 0.02 |
| 06. 25-30% | 211 | 06 | 0.03 | 0.02 | 0.03 | 0.04 |
| 07. 30-35% | 210 | 10 | 0.05 | 0.04 | 0.05 | 0.07 |
| 08. 35-40% | 210 | 19 | 0.09 | 0.07 | 0.09 | 0.11 |
| 09. 40-45% | 211 | 28 | 0.13 | 0.11 | 0.13 | 0.16 |
| 10. 45-50% | 210 | 37 | 0.18 | 0.16 | 0.18 | 0.21 |
| 11. 50-55% | 210 | 56 | 0.27 | 0.21 | 0.26 | 0.35 |
| 12. 55-60% | 211 | 101 | 0.48 | 0.35 | 0.47 | 0.63 |
| 13. 60-65% | 210 | 172 | 0.82 | 0.63 | 0.81 | 1.03 |
| 14. 65-70% | 210 | 309 | 1.47 | 1.03 | 1.47 | 2.02 |
| 15. 70-75% | 211 | 571 | 2.70 | 2.02 | 2.74 | 3.50 |
| 16. 75-80% | 210 | 941 | 4.48 | 3.52 | 4.43 | 5.58 |
| 17. 80-85% | 210 | 1533 | 7.30 | 5.60 | 7.17 | 9.65 |
| 18. 85-90% | 211 | 2843 | 13.47 | 9.69 | 13.05 | 18.31 |
| 19. 90-95% | 210 | 6222 | 29.63 | 18.37 | 27.95 | 48.01 |
| 20. 95-100% | 212 | 34857 | 164.42 | 49.78 | 95.37 | 1178.66 |


Wow! thx man. Nice List! Good 2 see it all at once.
I see graphs, i upvote :-) However it is nice to see well-written content be rewarded by the community.
Moreover it may be fun to analyze how those posts were written and try to figure out a way to improve not-so-successful posts.
Thanks bendelgreco. I agree but I also think thorough analysis through graphs and tables can communicate volumes. If it's any consolation, this took my a number of hours to prepare.
Yes, of course. Your post is great to consult these data! And just by looking at the data you gathered, one can consult the links you provided. So, once again, great post!
Yet another awesome analysis..thanks for sharing