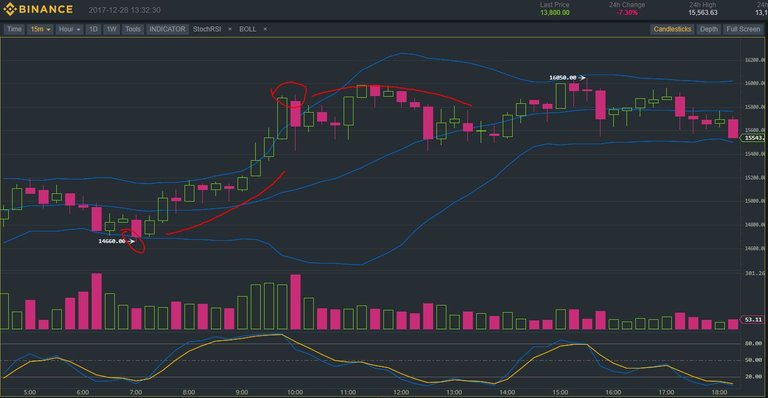
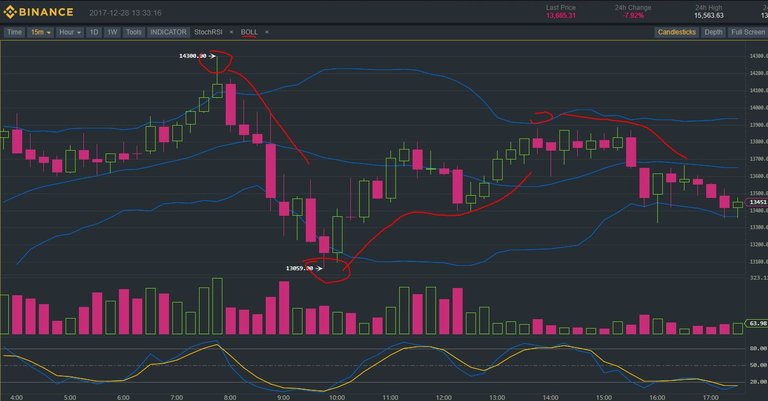
This is not a financial tip; but watch the patterns.
I love patterns since i was a kid; and I've been watching this carefully for hours and days now since I discovered this Bollinger thing existed.
There appears to be a strong relationship between Bollinger Bands and Crypto's value movement.
Watch this video
Ignore the portrait photo; and get into learning what Bollingers mean and use them.
Open the price graph and start recording the patterns.
When lowest candle marks below the line it may go up; and when the highest part of the candle goes over the mark.. it may go down.
It's weird but it's happening!
Please, this is just speculation because we cannot predict a market that is being changed based in the emotions of millions of people around the world.
I'm not a pro; but i like psychology and there's a higher scale range of emotions roller coasters going on in Bitcoin patterns.
Anyways; if someone wants tools for this... study Bollinger Cryptocurrency at youtube.
There appears to be a pattern each time price candles touch the bollinger mark.
I'm just sharing my experiences so far; tell me what you think about these tools and what other things you use "to predict" rises and dumps.


Great story
Thank you; I'm glad you like it.
nice...