This is the fourth part of article.
Pictures can be found on google.com
Part 1 can be found here: https://steemit.com/aggression/@psychnmore/video-games-nv-influence-on-aggressive-cognition-part-1
Part 2 can be found here: https://steemit.com/life/@psychnmore/video-games-nv-influence-on-aggressive-cognition-part-2
Part 3 can be found here: https://steemit.com/psychology/@psychnmore/video-games-nv-influence-on-aggressive-cognition-part-3

Results
1. Biological Data Results
1.1. Heart-rate and Breath-rate
In this part of the result section the data on breath-rate and heart-rate will be explored. It was predicted that with a significant change in the aggressive cognition over the different conditions of the experiment and an emotional arousal as a response to the change in the aggressive cognition, the breath-rate and heart-rate would change.
Figure 3 presents the means for the heart-rate over the three conditions of the experiment. The baseline, the first condition, represents data without influence from a session of gaming. While the second condition presents the data after the first game time on an easy difficulty, which provides little to no real challenge. Even for those participants that do not fit into the regular gamer category.
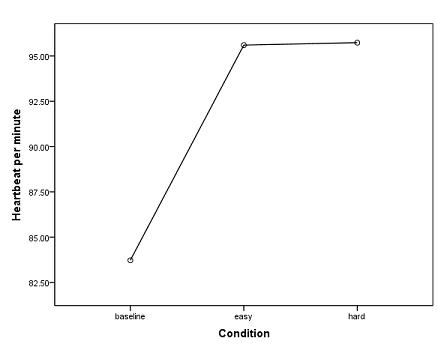
Figure 3: Heartbeat means
The figure shows that there is little to no difference between the conditions of the game times. The data presented in the figure indicates that the manipulation of the games difficulty might not have enough effect on aggressive cognition to provoke a change in the aggressive cognition and a real visible change in the rate of heartbeat in the participants.
A similar result can be found when looking at Figure 4, which presents the data on breath-rate in the same conditions as for the heartbeat.
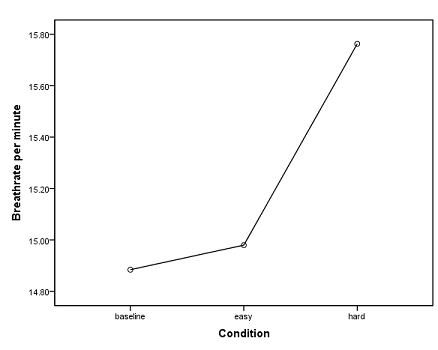
Figure 4: Breath-rate means
From the numbers on the left axis of figure 4 it is clear that the change of breath-rate between the conditions is very small.
Also the standard deviation for breath-rate over the three conditions was relatively stable. While the standard deviation for the heart-rate grew from condition to condition. But that could be related to individual differences in the heart condition and physical fitness of the participants. This can be seen in table 1.

Table 1: Standard Deviation Heart-Breath
To further analyse the data a within participants repeated measures Anova. No significant result was found for a difference in heart-rate or breath-rate, between the conditions. For the heart-rate the result of the comparison between condition 1 (baseline) and condition 2 (easy) was insignificant (F(1, 6) = 5.911, p = 0.051). With more participants it could provide a significant result as the border for significance p < 0.05 is close to the result.
Considering the result for the comparison between condition 3 (hard) and both previous conditions the result is insignificant (F(1, 6) = 0.897, p = 0.380). Again the manipulation of the difficulty level and the resulting challenge does not have the predicted change.
A similar result was found for the breath rate. Neither the comparison between condition 1 (baseline) and condition 2 (easy) (F(1, 6) = 0.002, p = 0.966), or between condition 3 (hard) and the previous conditions 1 and 2 (F(1, 6) = 0.264, p = 0.626) proved to be significant, of the level for significance is set to p < 0.05.
1.2. Blood pressure
For the blood pressure it was predicted that the values of the systolic and diastolic blood pressure will rise or fall if the participants show a change in the aggressive cognition and emotional arousal towards or away from aggression.
To explore the gathered data, the same approach as with the heart-rate and breath-rate was used. And the results were similar to the results from heart-rate and breath-rate. Indicating again that the manipulation of the difficulty level of the game was not enough to provoke a physical response if there was a change in the aggressive cognition and emotional state of the participants.
Figure 5 shows the data for the systolic blood pressure for the three conditions. While figure 6 shows the diastolic blood pressure under the same conditions.
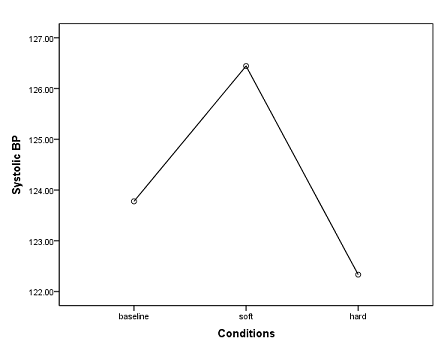
Figure 5: Means systolic BP
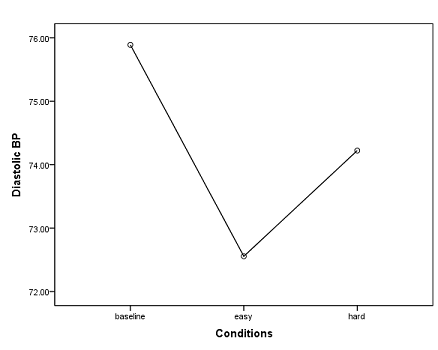
Figure 6: Means diastolic BP
And also similar to the heart-rate and breath-rate was the result for the standard deviation relatively stable. Table 2 provides the data on the standard deviation for the systolic and diastolic blood pressure for every condition. Variations could be accounted to the differences between the participants.
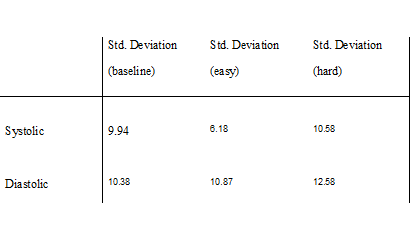
Table 2: Standard Deviation BP
To analyse the data the same Anova was used, as with the data for heart-rate and breath-rate. As mentioned the results were similar to the results for heart-rate and breath-rate. Which means not significant. The result for the comparison between condition 3 (hard) and the previous conditions 1 (baseline) and 2 (easy) (F(1, 8) = 1.343, p = 0.28) indicated no significant difference for the systolic blood pressure. The result of the within participants repeated measurements Anova for the diastolic showed the insignificant result very clearly (F(1, 8) = 0.000, p = 1.00).
2. Implicit Association Test Data Results
2.1. Implicit Association Test - Reaction Times
With no significant results in the area of biological data, the data collected with the Implicit Association Test (IAT) could still indicate a significant change in aggressive cognition, when playing non-violent video games.
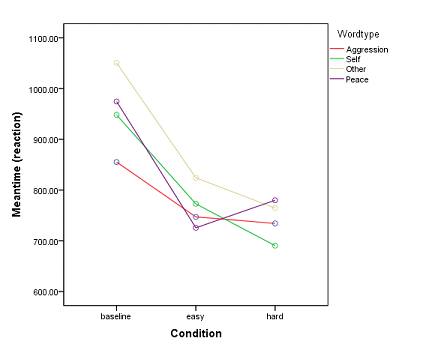
Figure 7: Meantime for Word types
When looking at figure 7 and the data it provides, it shows that for the control groups (self and other) the reaction time becomes less after playing the video game conditions. For the stimuli (aggression and peace) the change was different. The reaction speed to both stimuli became faster, but considering that condition 2 (easy) is no challenge and rewards the player with first place in the race, it is interesting that the participants became faster in reacting to peaceful words then to aggressive words. This effect changes with the manipulation of the game difficulty. In condition 3 (hard) the participants are again faster to react to aggressive words. But without further analysing the data it is hard to tell if the difference is significant as the differences in the mean times for the reactions are small. Also the form of the graph poses a question and thereby a problem. This will be explained in the first part of the discussion section.
Comparing the standard deviation between the conditions for each word type shows no unusual developments (see table 3).
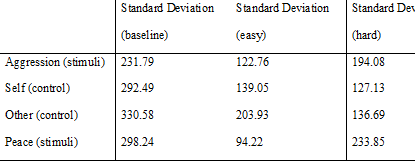
Table 3: Std. Dev. for Meantime's
In order to analyse the data a within participants repeated measurements Anova was used. The design had 3 conditions (baseline, easy, hard) and 4 levels, in form of the word types. These could influence the dependant variable (reaction time).
The result for the conditions was significant (F(2,16) = 13.989, p = 0.000), as was the result focused on the word types (F(3, 24) = 3.596, p = 0.028), with a significance level of p < 0.05. These significant results indicate that the reaction time in changes with the conditions, and that there is a difference for the mean times of the different word types. The analysing provided no significant result for an interaction effect between the independent variables (condition, word type) (F(6, 48) = 1.125, p = 0.362), with a significance level of p < 0.05.
But even with a significant difference in the reaction times between the conditions and word types, it is not possible to conclude a significant change in the aggressive cognition of the participants. It could be argued that there was a change in aggressive cognition when looking at the different conditions, but there was also a significant difference when looking at the word types alone. So it could mean there was a overall change in the reaction speed of the participants and it also hints towards a learning process.
2.2. Implicit Association Test - Self-Aggression vs. Other-Aggression
To have more insight and understanding if there is a change in aggressive cognition in the participants, two trails of the IAT were extracted and analysed to see if there is a change in reaction speed not only for the stimuli (aggression, peace) alone, but also when the stimuli are connected to one of the control groups (self, other). Thereby creating an association between the aggressive word and the self or others.
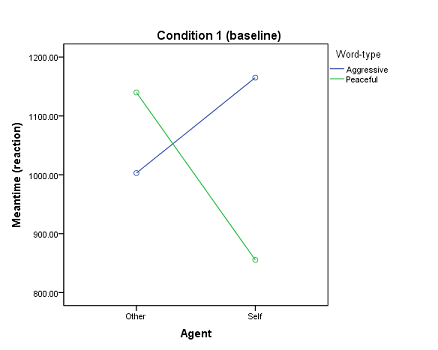
Figure 8: Meantime Agent/Word-type C1
Looking at figure 8 shows the means for the condition 1 (baseline) and tells us that the participants are more likely to view others as aggressive, than they would see themselves as aggressive. As a consequence the participant is also more likely to see himself as peaceful, than others.
In figure 9, for the condition 2 (easy), the participants needed less time to react to the stimuli and control groups. Like with the general mean times of the IAT this indicates a general improvement for the reaction speed. Possibly through a learning process.
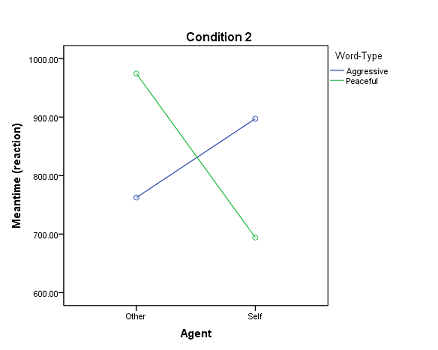
Figure 9: Meantime Agent/Word-type C2
With condition 3 (hard) (figure 10), the reaction mean times become faster for aggression in combination with others, but became slower if connected to the self. When comparing the condition 3 (hard) to condition 2 (easy). The reaction times for the peaceful words in combination with self or others did not change as much as the combination with the aggressive words. With more data the change might become more obvious in the graphic's.
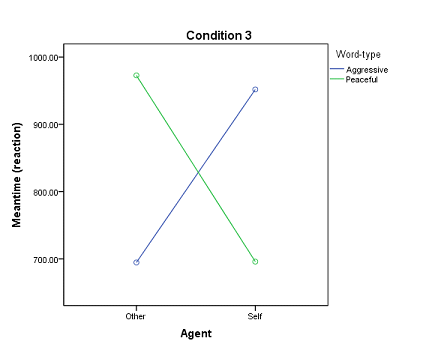
Figure 10: Meantime Agent/Word-type C3
And like the data sets, the standard deviation for this data is relatively stable and does not show unusual peaks or developments between the conditions (see table 4). The standard deviation supports the assumption of the researcher that the participants are more stable in processing others as aggressive and themselves as peaceful, then others as peaceful and themselves as aggressive.
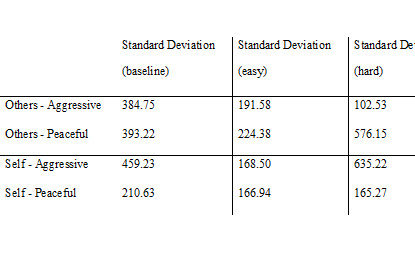
Table 4: Std. Dev. for Meantime's trail3 vs. trail5

Figure 11: Design 3x2x2
To further analyse the data with a within participants repeated measures Anova was used. The design changed to 3x2x2 (see figure 11).
After analysing the data with the Anova the results showed a significant result for the condition (F(2, 14) = 5.024, p = 0.023) with p < 0.05. This means there was a significant change in the reaction times for the stimuli-control combinations. But these reaction times were not significantly influenced by the self or other (F(1, 7) = 2.56, p = 0.154) with p < 0.05.
The result was also insignificant for the word type (aggressive, peaceful) with p < 0.05 (F(1, 7) = 0.595, p = 0.466).
The interactions between condition, agent (self, other) and word type (aggressive, peaceful) have no significant results. Except the interaction effect between agent and word type (F(1, 7) = 5.737, p = 0.048).
!As always. Errors in spelling etc. are possible as English is not my native language.!
The final part will be online next Sunday.
I don't know how others look at it, but for me writing up result sections is always the most boring part of any project. But it has to be done.
Thanks for sharing... Love it.
Congratulations @psychnmore! You have completed some achievement on Steemit and have been rewarded with new badge(s) :
Click on any badge to view your own Board of Honor on SteemitBoard.
For more information about SteemitBoard, click here
If you no longer want to receive notifications, reply to this comment with the word
STOP