📈 # BTC
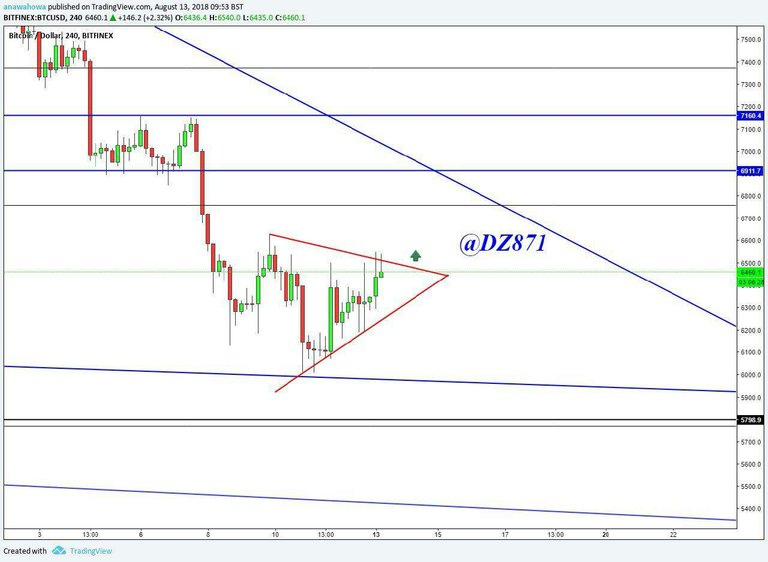
▪️Yesterday the pair consolidated in a tapering range, limited by the trend line of declining highs and the lows line. On the hourly chart, it is worth paying attention to the candle with the largest spread of the minimum and maximum, which accounts for the largest volume of trades. It points to some nervousness of the market and the ambiguity of the forthcoming breakout of the triangle.
▪️The Bitcoin broke the $ 6450 level and tested it from the bottom for the second day in a row. MACD has a small bullish convergence, which speaks in favor of breaking through resistance $ 6450. In this case, we enter the longs at a price of $ 6,600. In this case, the moving averages continue to press on the coin, the EMA50 crossed EMA200 downwards. If Bitcoin descends to support $ 5770 and pierces it, we enter short positions starting at $ 5600.
▪️It is possible that before a break down, there may be a false breakdown of the upper trend line with a resistance test in the form of a zero Fibonacci level (6615.00 USD).
Support: 5770 (annual minimum); 6100.
Resistance: 6450 (minimum of April 1); 6840; 7220; 7530; 7790; 8000; 8300; 8550; 8620; 8900; 9350.
Posted using Partiko Android
Thank you for your updated.
Posted using Partiko Android
Thanks @partiko Your App Very Useful Instant Access Steemit Account
Posted using Partiko Android
Congratulations @paidtradingcoach! You have completed the following achievement on Steemit and have been rewarded with new badge(s) :
Click on the badge to view your Board of Honor.
If you no longer want to receive notifications, reply to this comment with the word
STOP