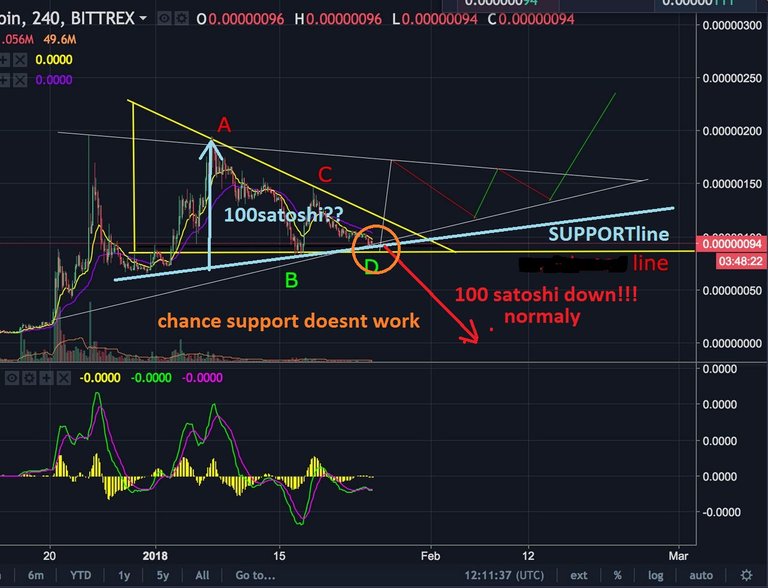
Your resistance line is a SUPPORTLINE because the actual price is trading above this line!
This yellow line is drawn strange. Normaly it should connect the bottoms of candles. This line you are drawing is in the air for me.
You are viewing a single comment's thread from:

Thank you for your response. The line is actually not drawn in the air and it is touching the bottom of the candle bars. The last light, which is looking like its drawn in the air is actually not yet completed. it needs to go down to touch the yellow line before it either shoots up or down as you predicted.
Your yellow line doesnt connect at least 2 points. I only can see it touches at B. I predict nothing. Its only possible. Maybe you are right... If it goes under low price of B i would defenetly sell instead of hope...
I couldn't agree more. You are awesome! Thank you so much for taking the time to look into my graph and share your perspective! : )