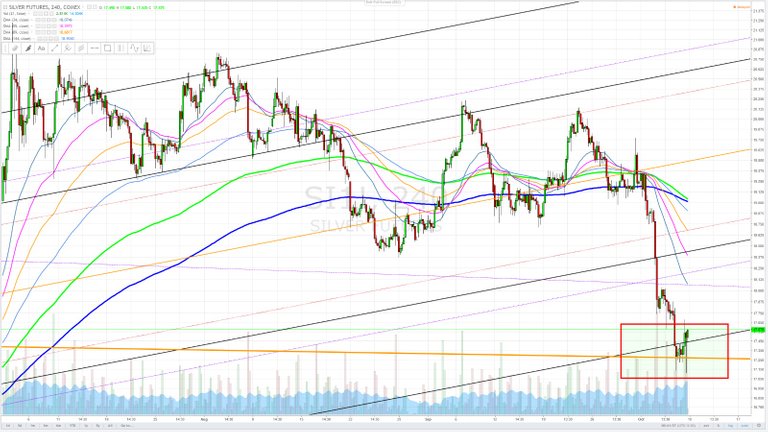
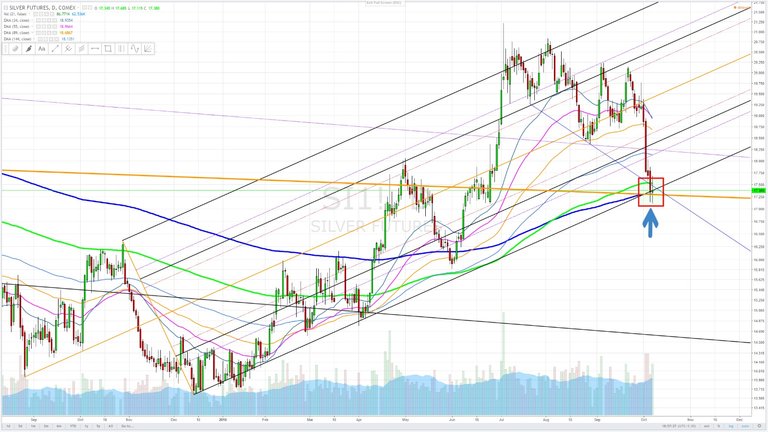
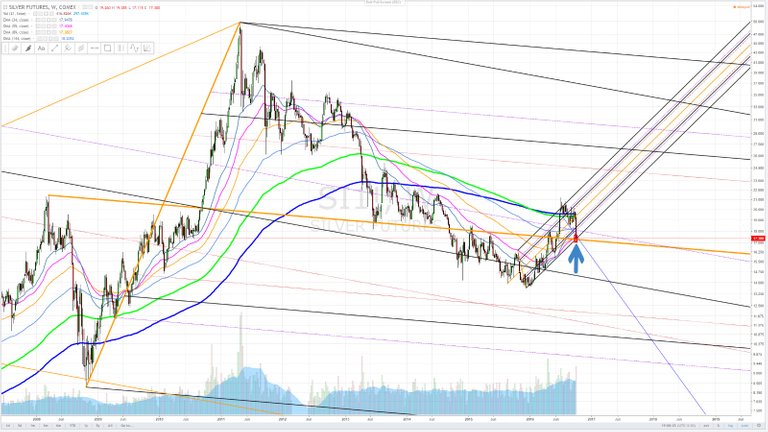
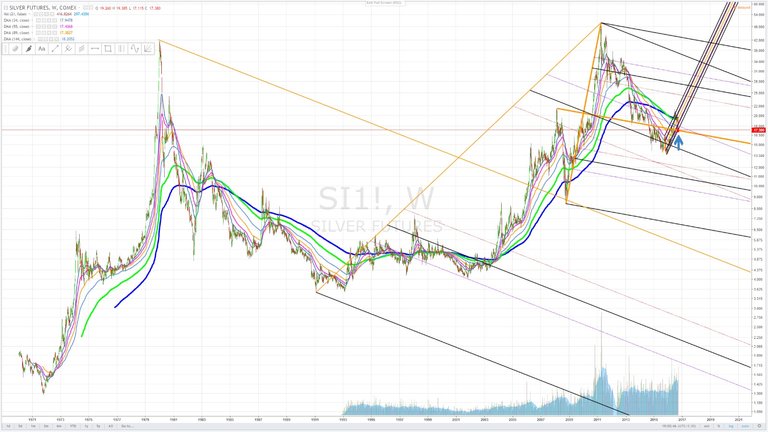
I use a tool called Andrews Pitchfork to find possible support / resistance targets. I have 4 charts that could indicate possible support at this juncture.
At it's basic...... Andrews Pitchfork is three parallel lines. The lines come from the most recent pivot points at a degree in time to form prongs and a
handle. It gives you support and resistance targets and possible future trend. The pitchforks in the charts below also have Fibonacci lines between the
center median line.
The chart below..... Silver 4hr cycle chart - intersection of support - EMA - Andrews Pitchfork - October 7, 2016

Silver Daily chart - intersection of support - EMA - Andrews Pitchfork - October 7, 2016

Silver weekly chart - intersection of support - EMA - Andrews Pitchfork - October 7, 2016

Silver weekly chart to 1971 - intersection of support - EMA - Andrews Pitchfork - October 7, 2016

Pitchforks are so useful. One of very few time AND price tools, rolled up into one...and it just seems to work, more than a lot of the more popular tools like horizontal s/r and the fibonacci tool.
Nothing's 100% but it does give an alternate view.
May be silver gets support at this time :-) Thanx for the interesting report.
Odds in favor at this point in time. However... can't be dogmatic about an idea.
I believe we will take out the July high next.