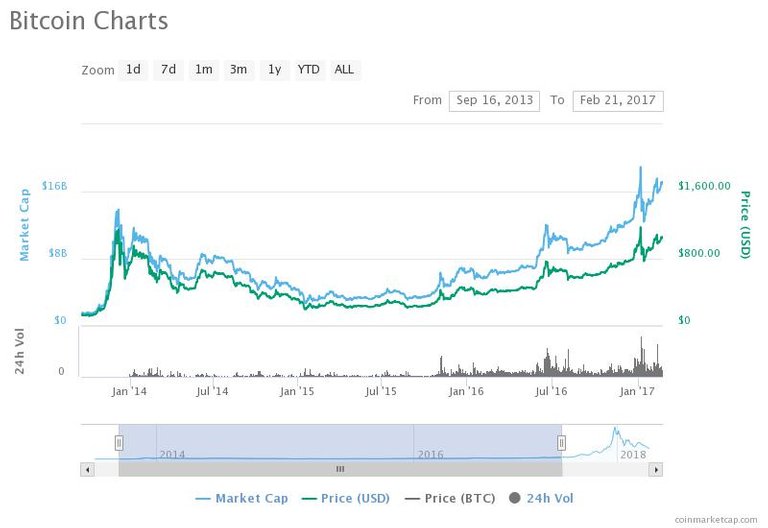
Above Chart of Bitcoin from around December 2013 / January 2014 :-
Here you Can see Bitcoin was Badly Pump from 130$ to 1127 $ around around in 1 and 1/2 month . after than Bitcoin Remain to fall for whole 1 years overall . its has Taken around 3 years to cross through ATH , i.e in January 2017
Now Lets Talks About Currenct Situation
.jpeg)
Above Chart is From around Juner 2017 to Current Date
In this Chart We Can See Bitcoin was Again Badly Pump in November/ December again In Same TIme Period from around 2000$ to 19000 .
after That its Continuos to Fall now it hanging around 6400$ .
ConClusion :-
- It will be 10%-20% up and Down for Long Period of Time like in Case of 2014-15 after Fall
- it will Again Badly Pump in Month of November to January period of Time ( maybe in 2019 or 2020)
- After Certain Period of Time Bitcoin Will Continue yo Rise Slowely
- we Have seem when Bitcoin get badly pump i ead around 9x to 10x , so In next pump we Can see Bitcoin to around 50000$ than gain it will get Correnction
( its all about my Suggestion , On Basis of Chart and Techinal Analysis )
DYOD